Date: Mon, Nov 17, 2025 | 06:00 AM GMT
The broader altcoin market continues to witness sharp downside volatility as Ethereum (ETH) extends its 30-day correction beyond 17%, weighing heavily on major altcoins — including Solana (SOL).
SOL has dropped nearly 23% over the past month, but beneath the price weakness, something far more constructive is forming. A clean harmonic pattern is emerging on the chart, suggesting that a potential rebound may be closer than many expect.
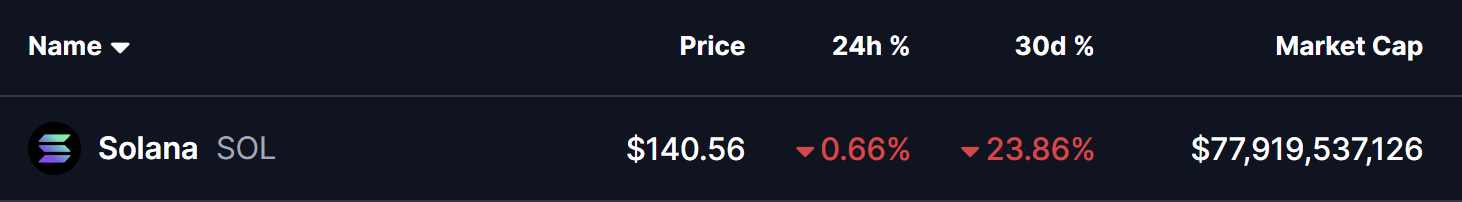 Source: Coinmarketcap
Harmonic Pattern Signals More Upside
On the 4-hour timeframe, SOL is shaping up a Bearish Cypher harmonic pattern — a structure known for generating upside momentum during its final CD-leg, before completing at the Potential Reversal Zone (PRZ).
The pattern began at Point X around $205.12, followed by a sharp decline into Point A, a corrective rebound to Point B, and finally a deeper leg lower into Point C near $134.44. From this low, Solana has begun to recover gradually and is currently trading around $140.55, reflecting early signs of stability and strengthening buyer interest.
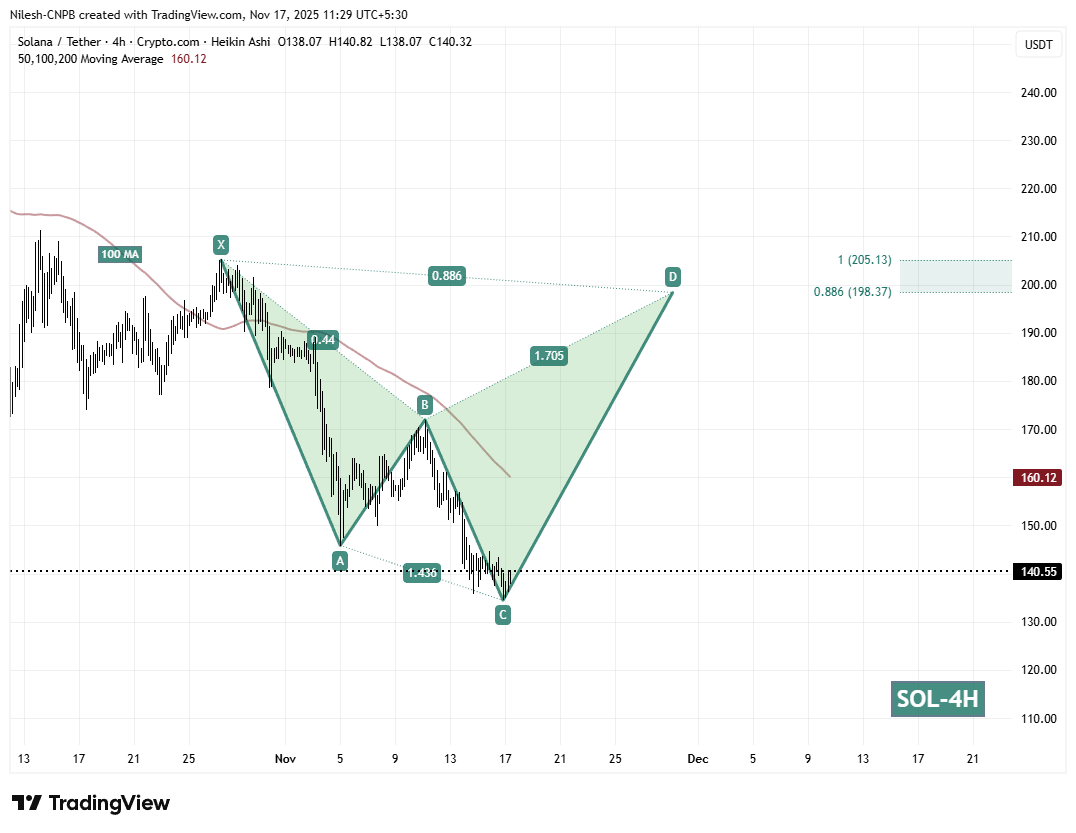 Solana (SOL) 4H Chart/Coinsprobe (Source: Tradingview)
Additional support for this move comes from the 100-hour moving average, sitting near $160.12 — a key dynamic resistance that bulls will need to reclaim to validate a stronger trend recovery ahead.
What’s Next for SOL?
The most critical level in the short term is the C-support near $134.44. Holding above this zone keeps the harmonic pattern active and preserves the bullish potential.
If SOL maintains this support and pushes higher, the next major hurdle will be reclaiming the 100-hour moving average ($160.12). A decisive break above this level would further confirm momentum and likely accelerate the CD-leg toward the upside.
Based on the harmonic structure, SOL’s path points toward the Potential Reversal Zone (PRZ) between $198.37 (0.886 Fibonacci extension) & $205.13 (1.0 Fibonacci extension). This region marks where the cypher pattern is expected to complete and where larger resistance or potential trend reversal could occur.
However, if SOL falls below $134.44, the bullish structure weakens significantly, opening the door for deeper downside tests before any meaningful recovery attempt can develop.