XRP Breakout Signals Fresh Bull Run Could be Underway

XRP's technical indicators suggest a new bull run may be on the horizon, with a break above key resistance and growing buying pressure signaling more potential upside.
Ripple’s XRP has gained 3% in the last 24 hours, riding the wave of renewed optimism in the broader cryptocurrency market.
While the increase may appear modest, underlying technical indicators suggest the XRP token rally has more room to run. This analysis holds the details.
XRP Clears Key Resistance—Technical Indicators Point to More Upside
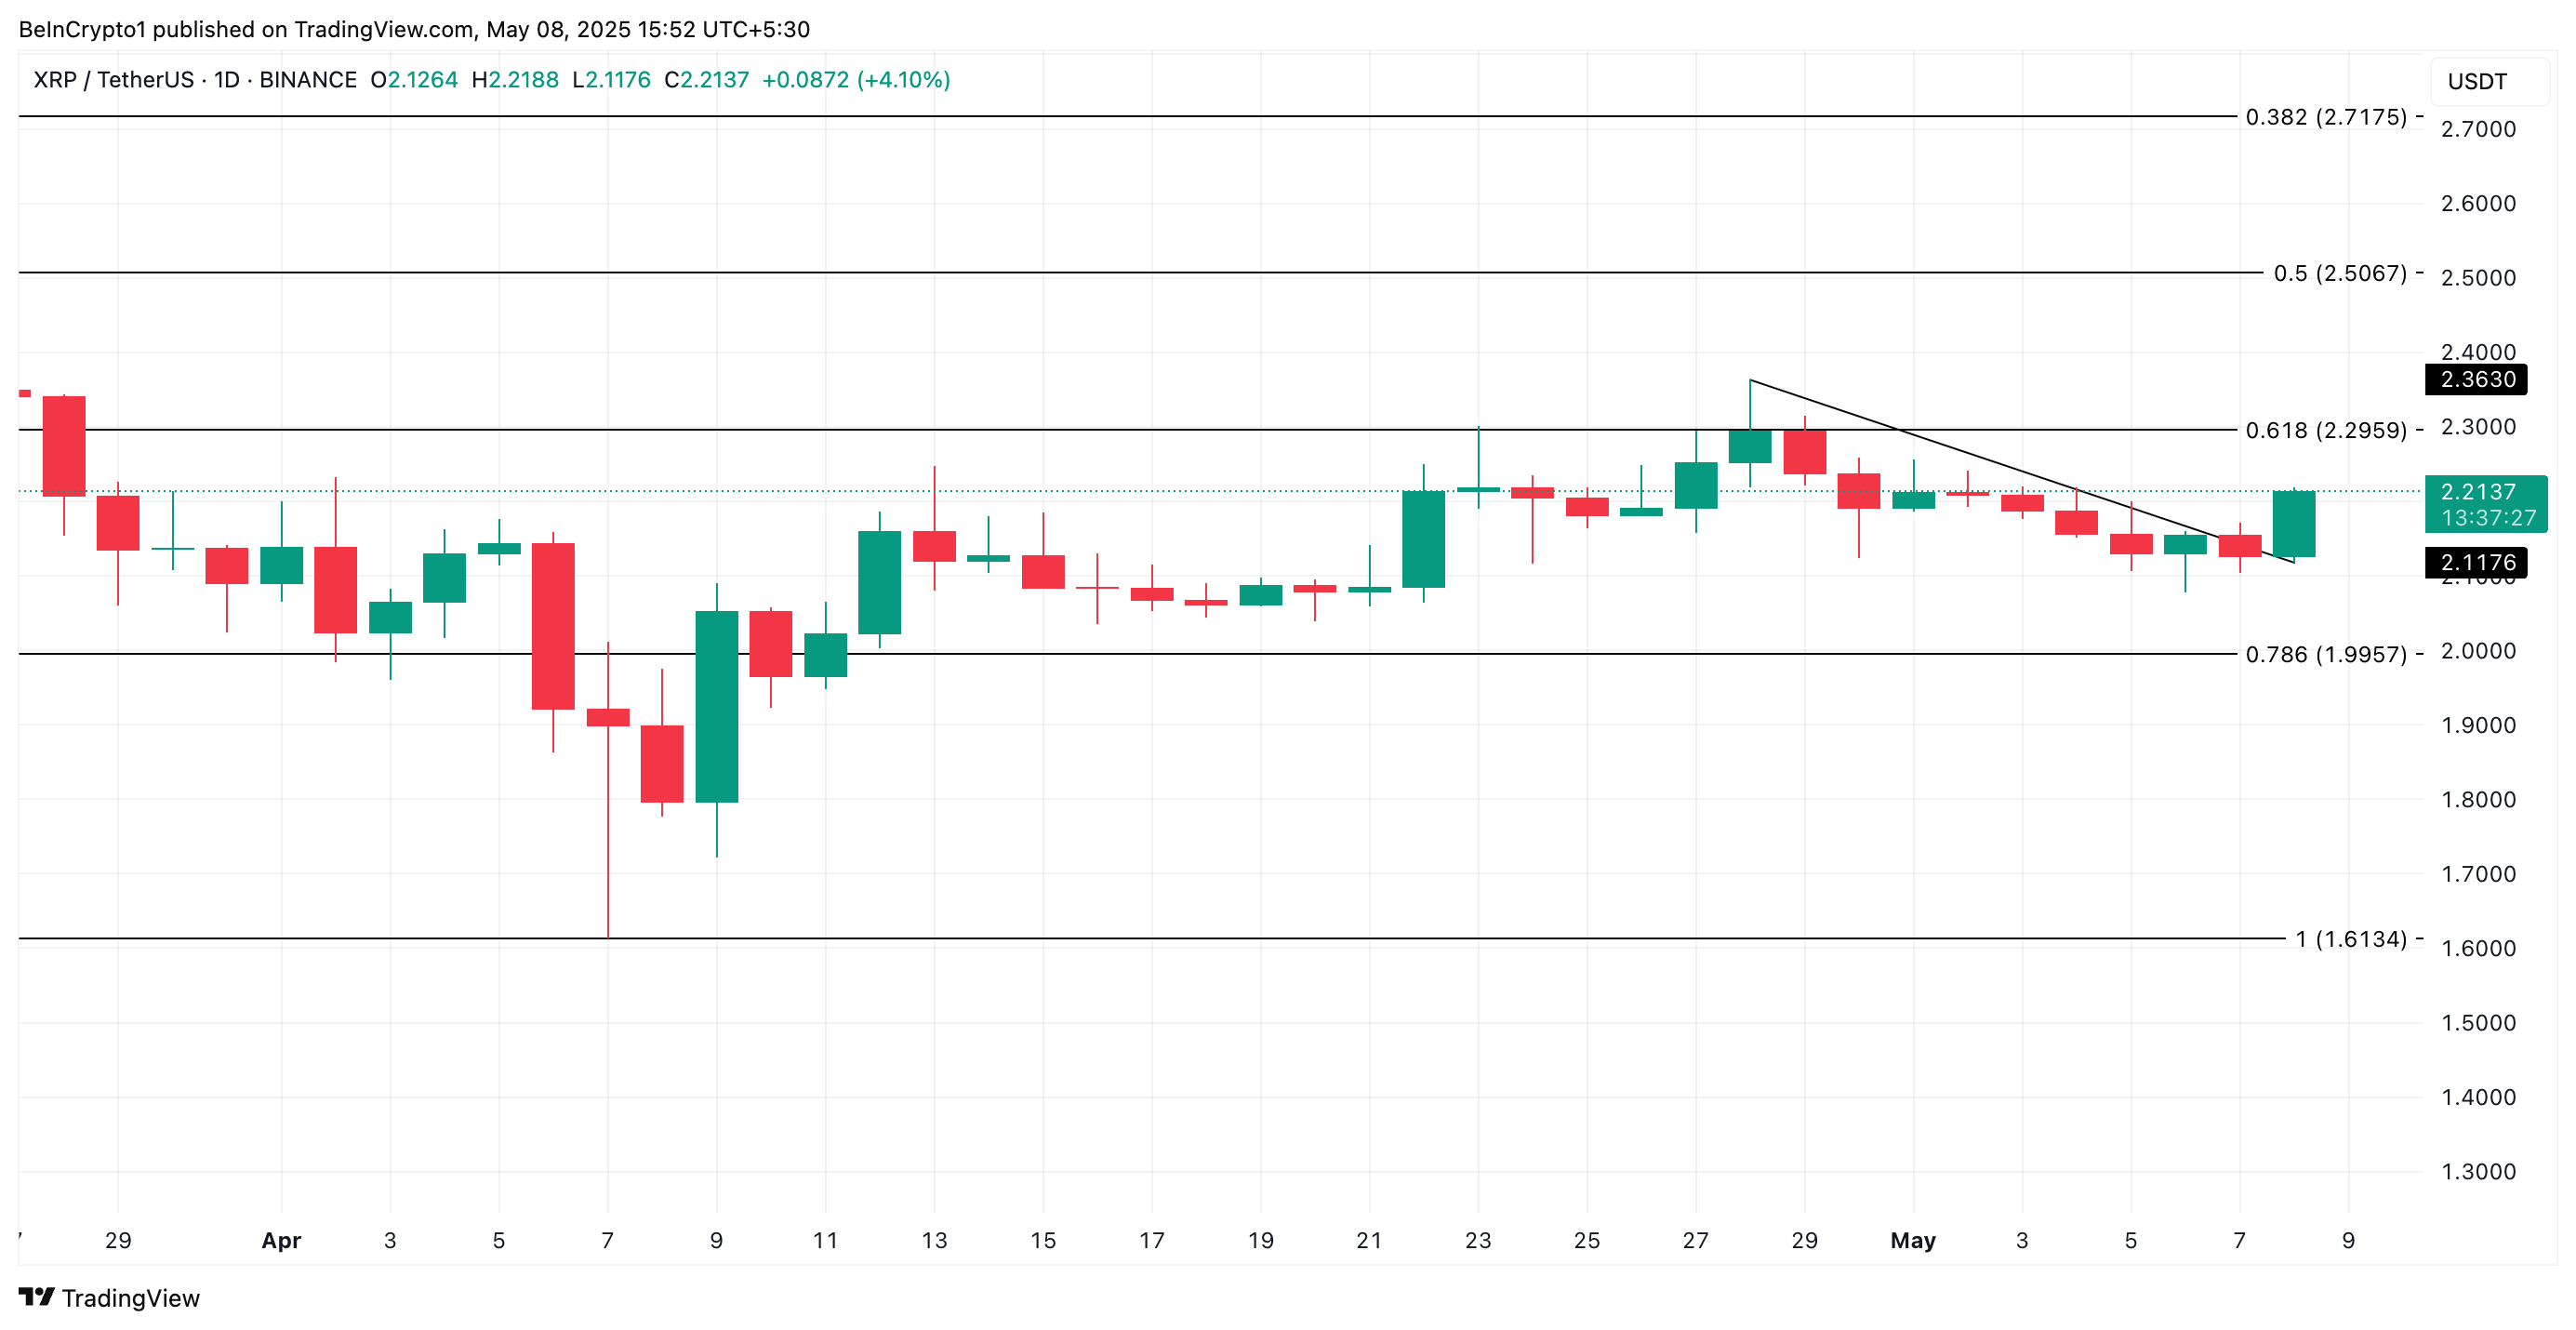
XRP has successfully broken above a descending trendline, overcoming a key resistance level that had capped its upside since the end of April. This move signals a trend reversal and puts XRP in a favorable position for further gains.
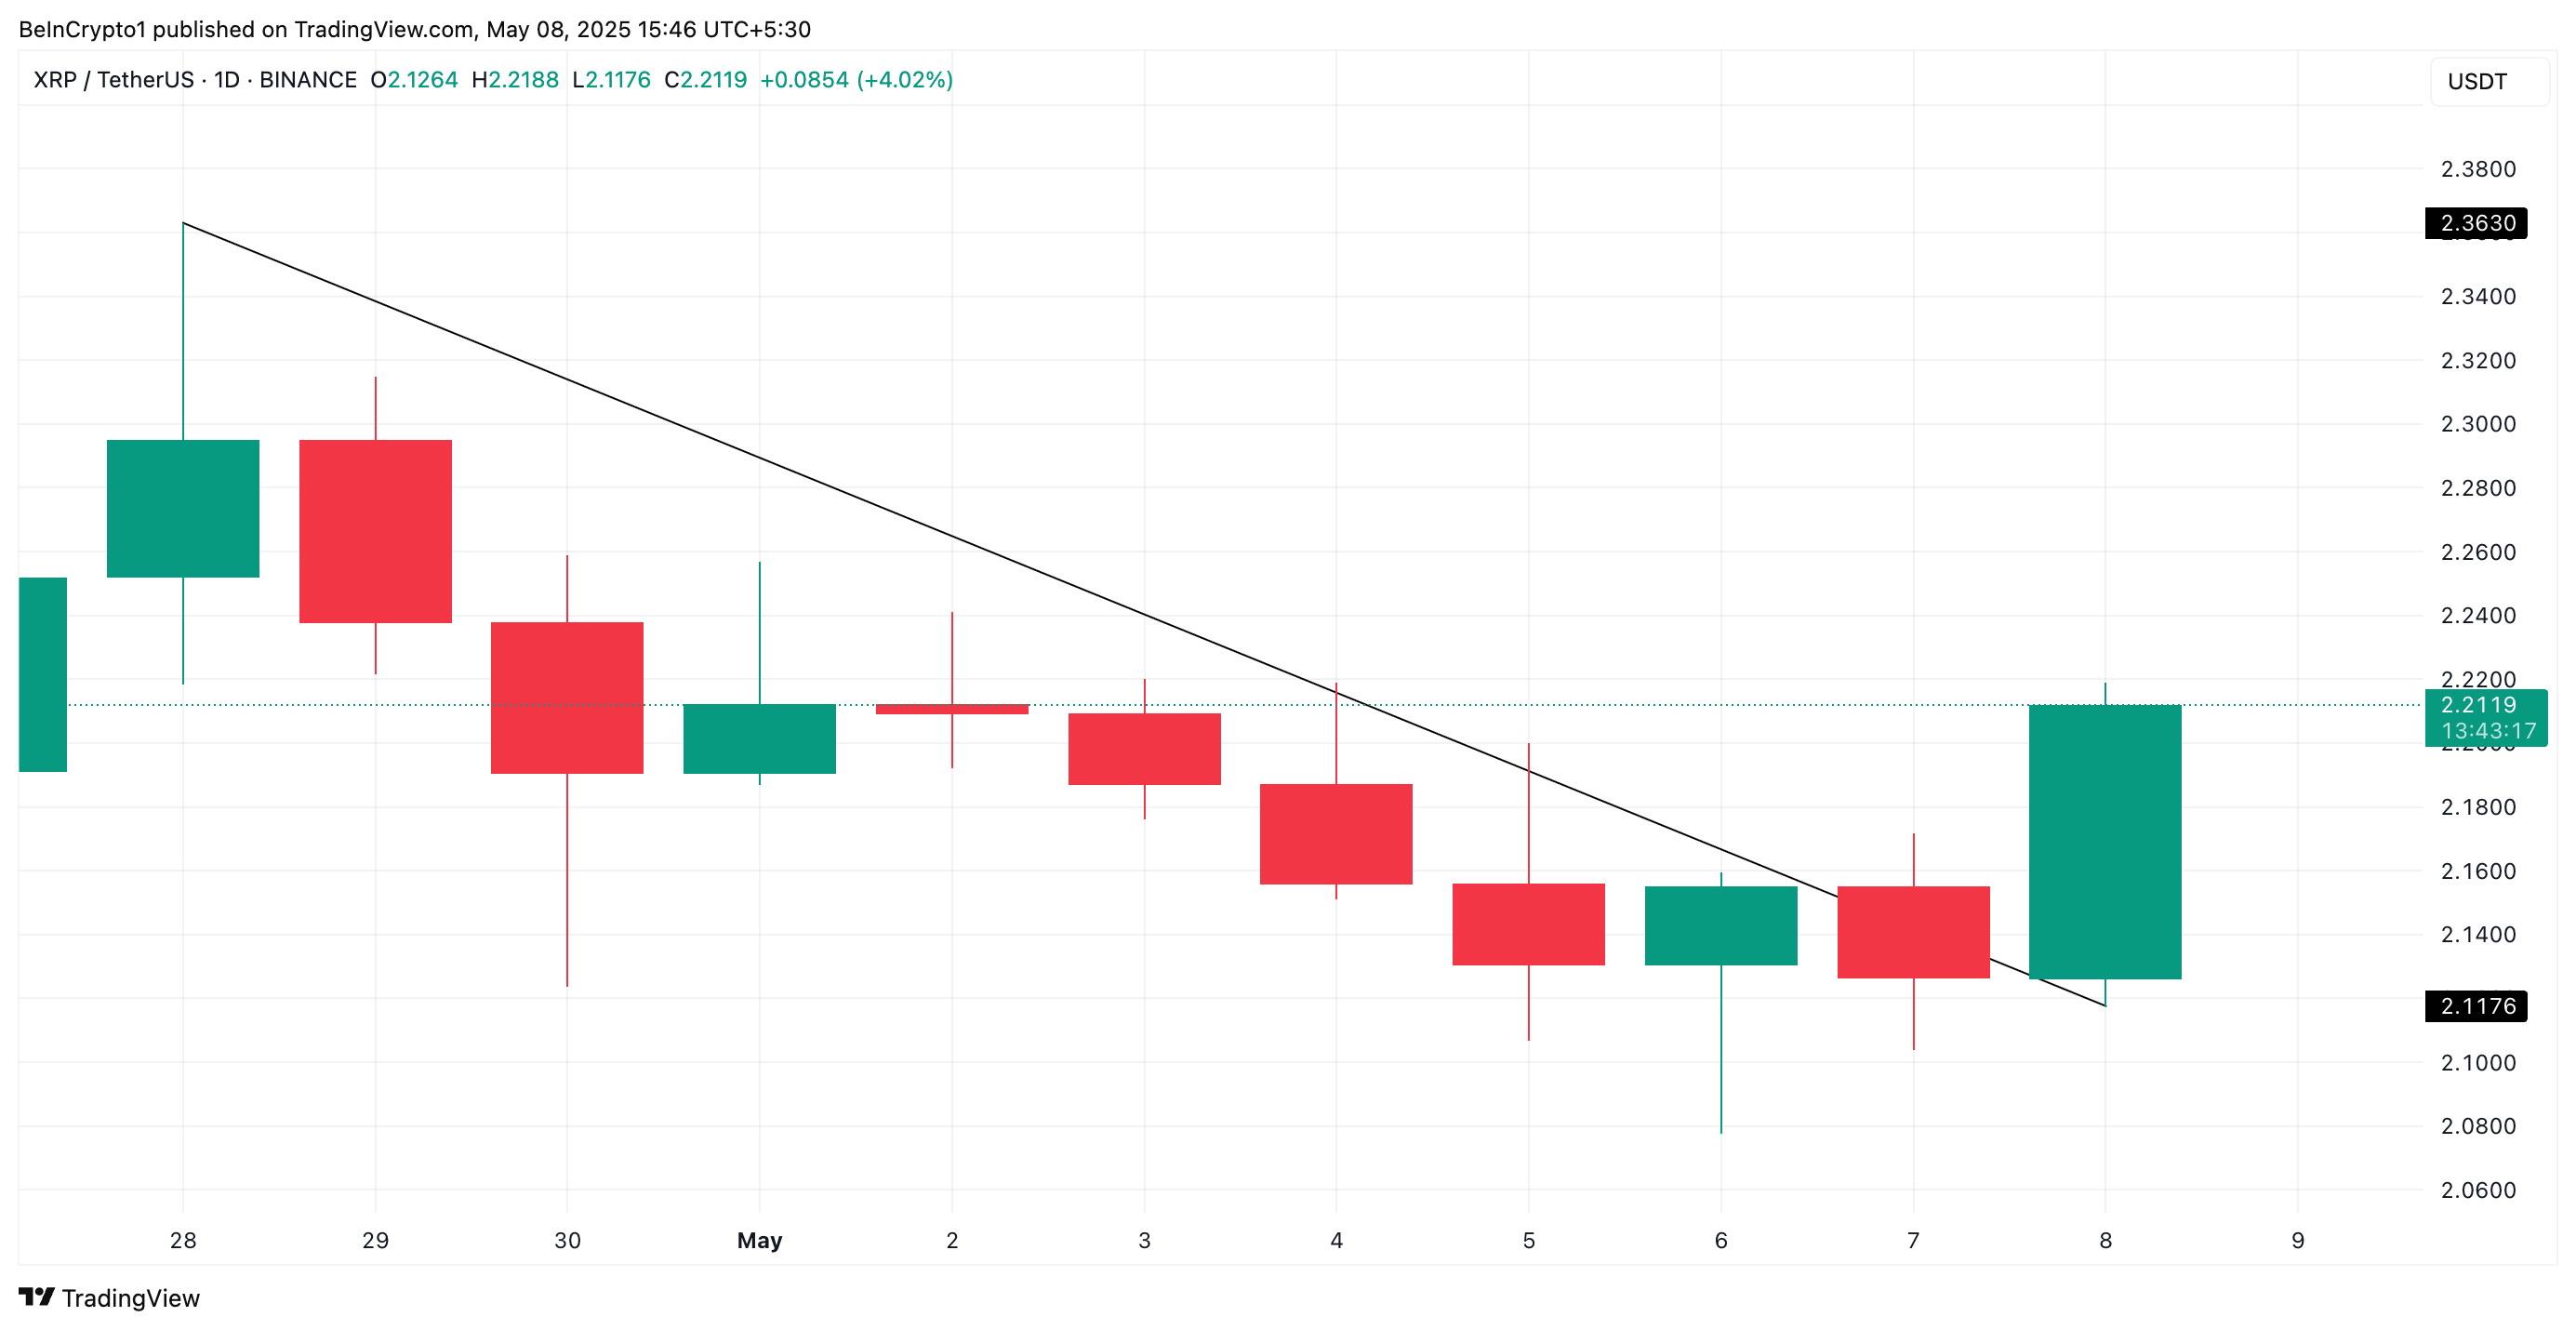 XRP Descending Trend Line. Source:
TradingView
XRP Descending Trend Line. Source:
TradingView
Readings from XRP’s Relative Strength Index (RSI) support this bullish outlook. At press time, the momentum indicator is at 54.11, noting a steady uptick.
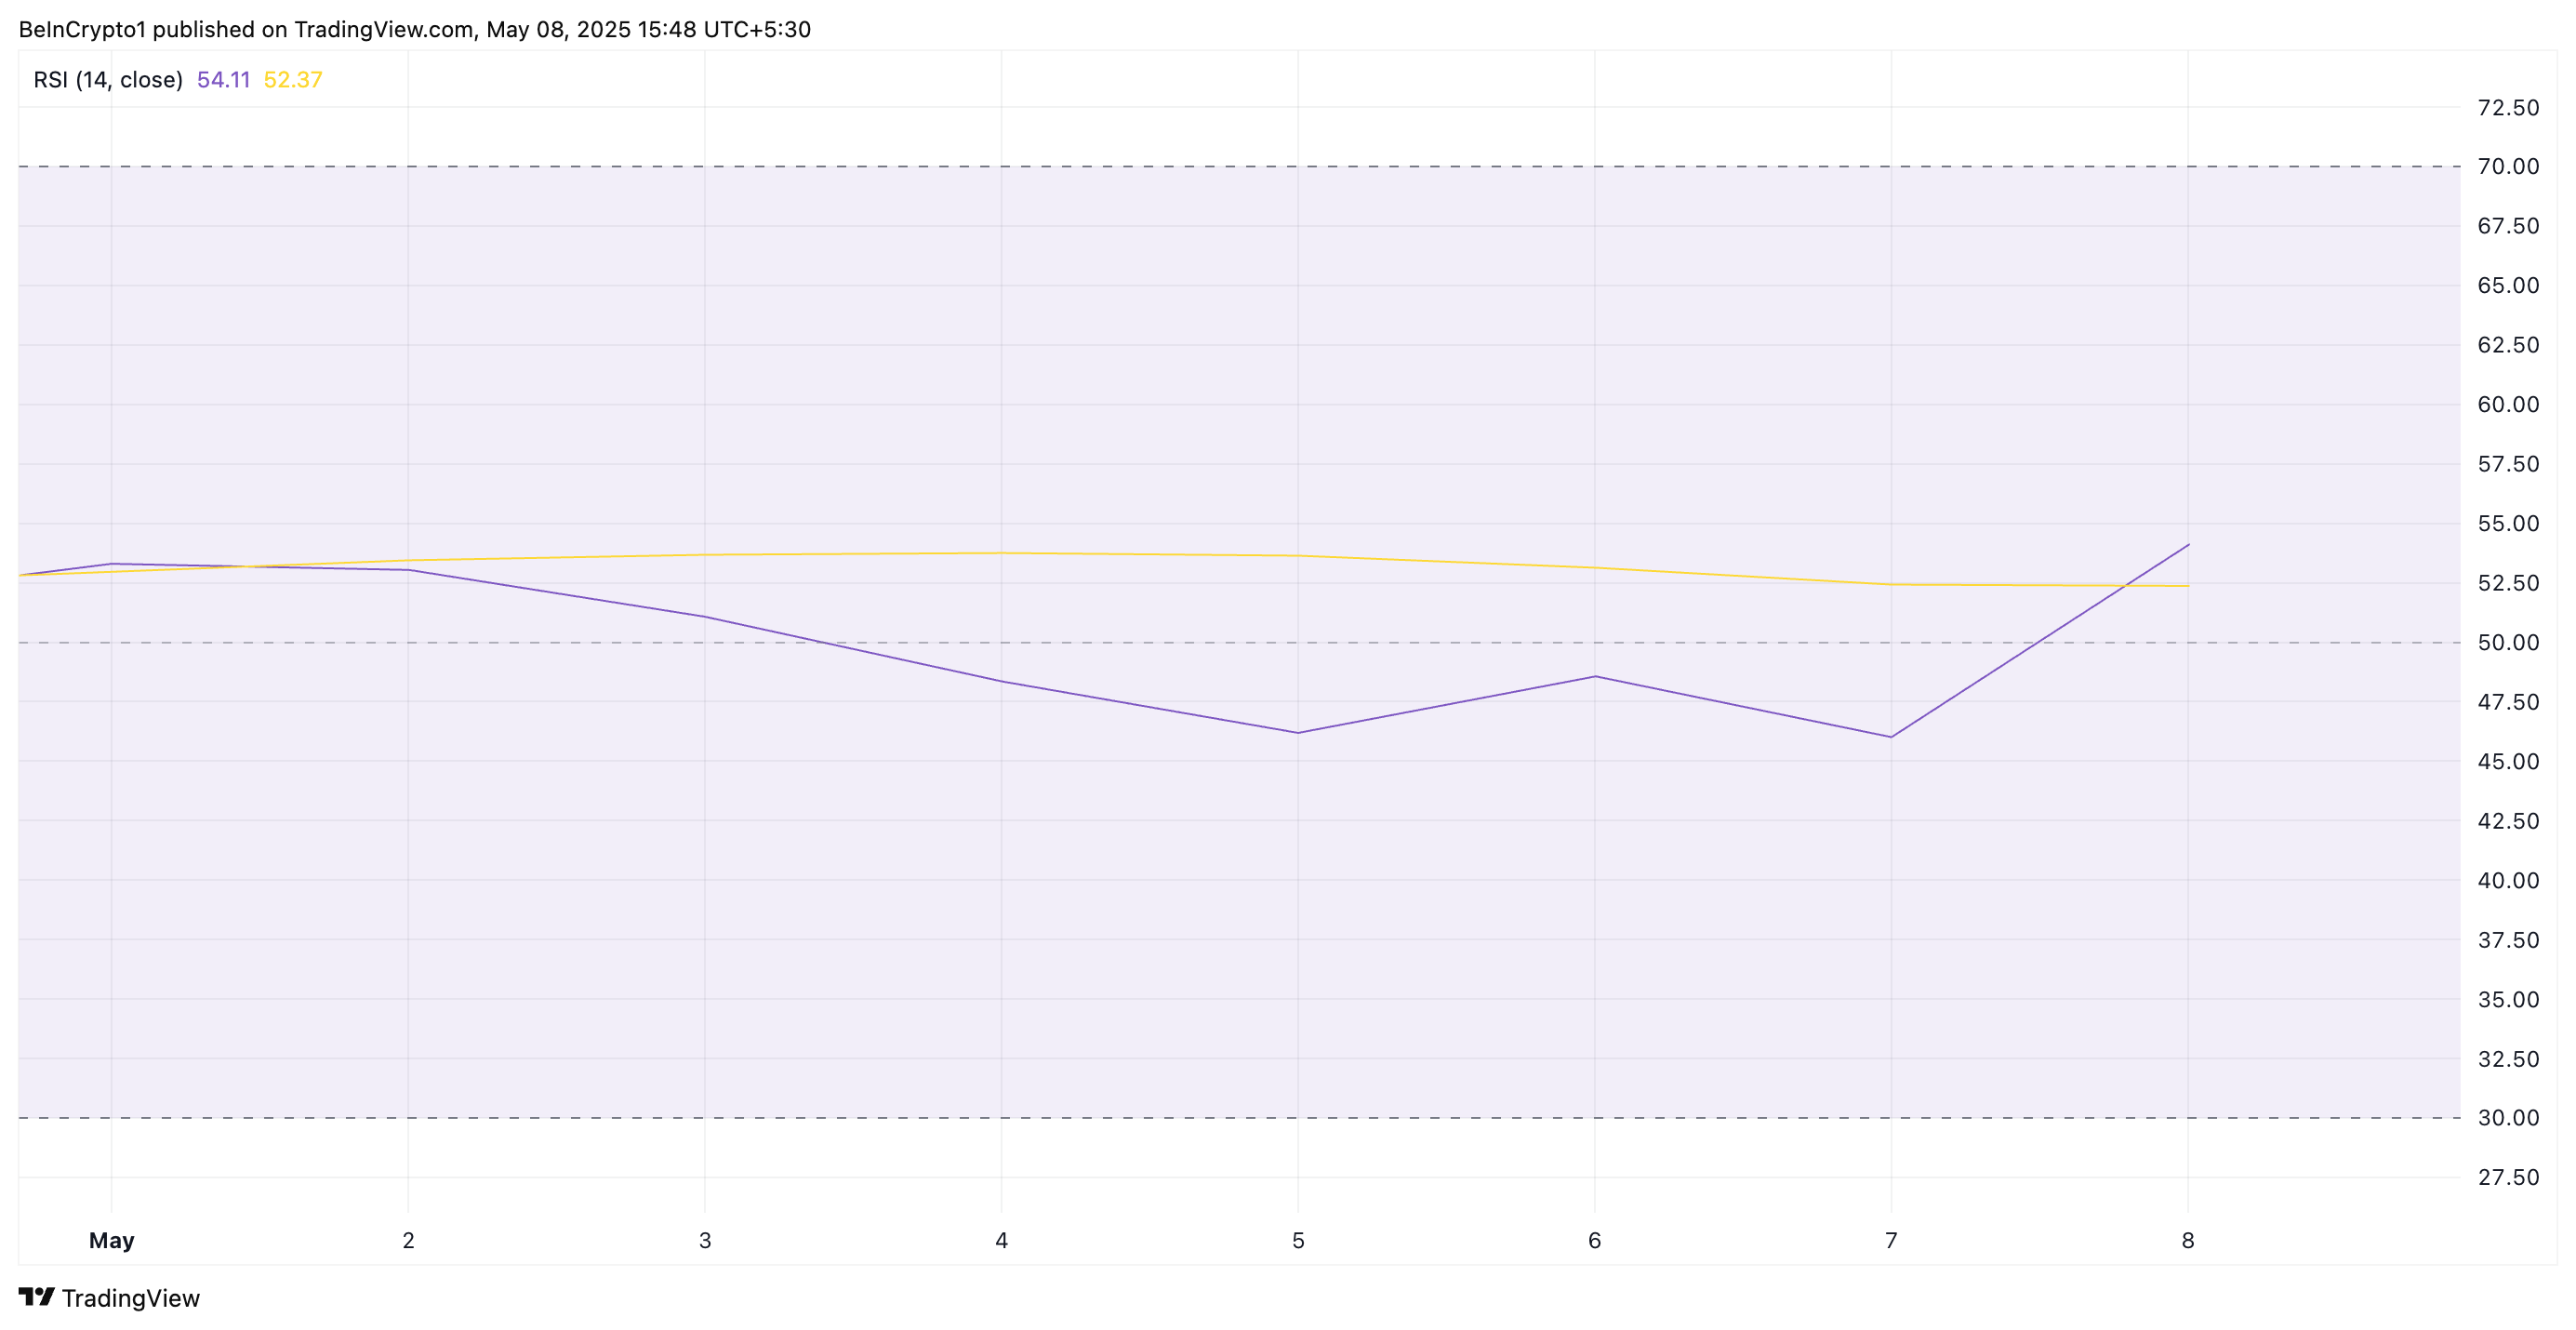 XRP RSI. Source:
TradingView
XRP RSI. Source:
TradingView
The RSI indicator gauges whether an asset is overbought or oversold. It ranges from 0 to 100, with readings above 70 typically signaling overbought conditions and a potential price decline. Conversely, values below 30 suggest the asset is oversold and may be due for a rebound.
At 54.11 and climbing, XRP’s RSI indicates that buying pressure is strengthening. It also hints at the likelihood of more gains before the token becomes overbought.
Likewise, XRP’s Balance of Power (BoP) returns a positive value at press time, highlighting the bullish bias toward the altcoin. It currently stands at 0.86.
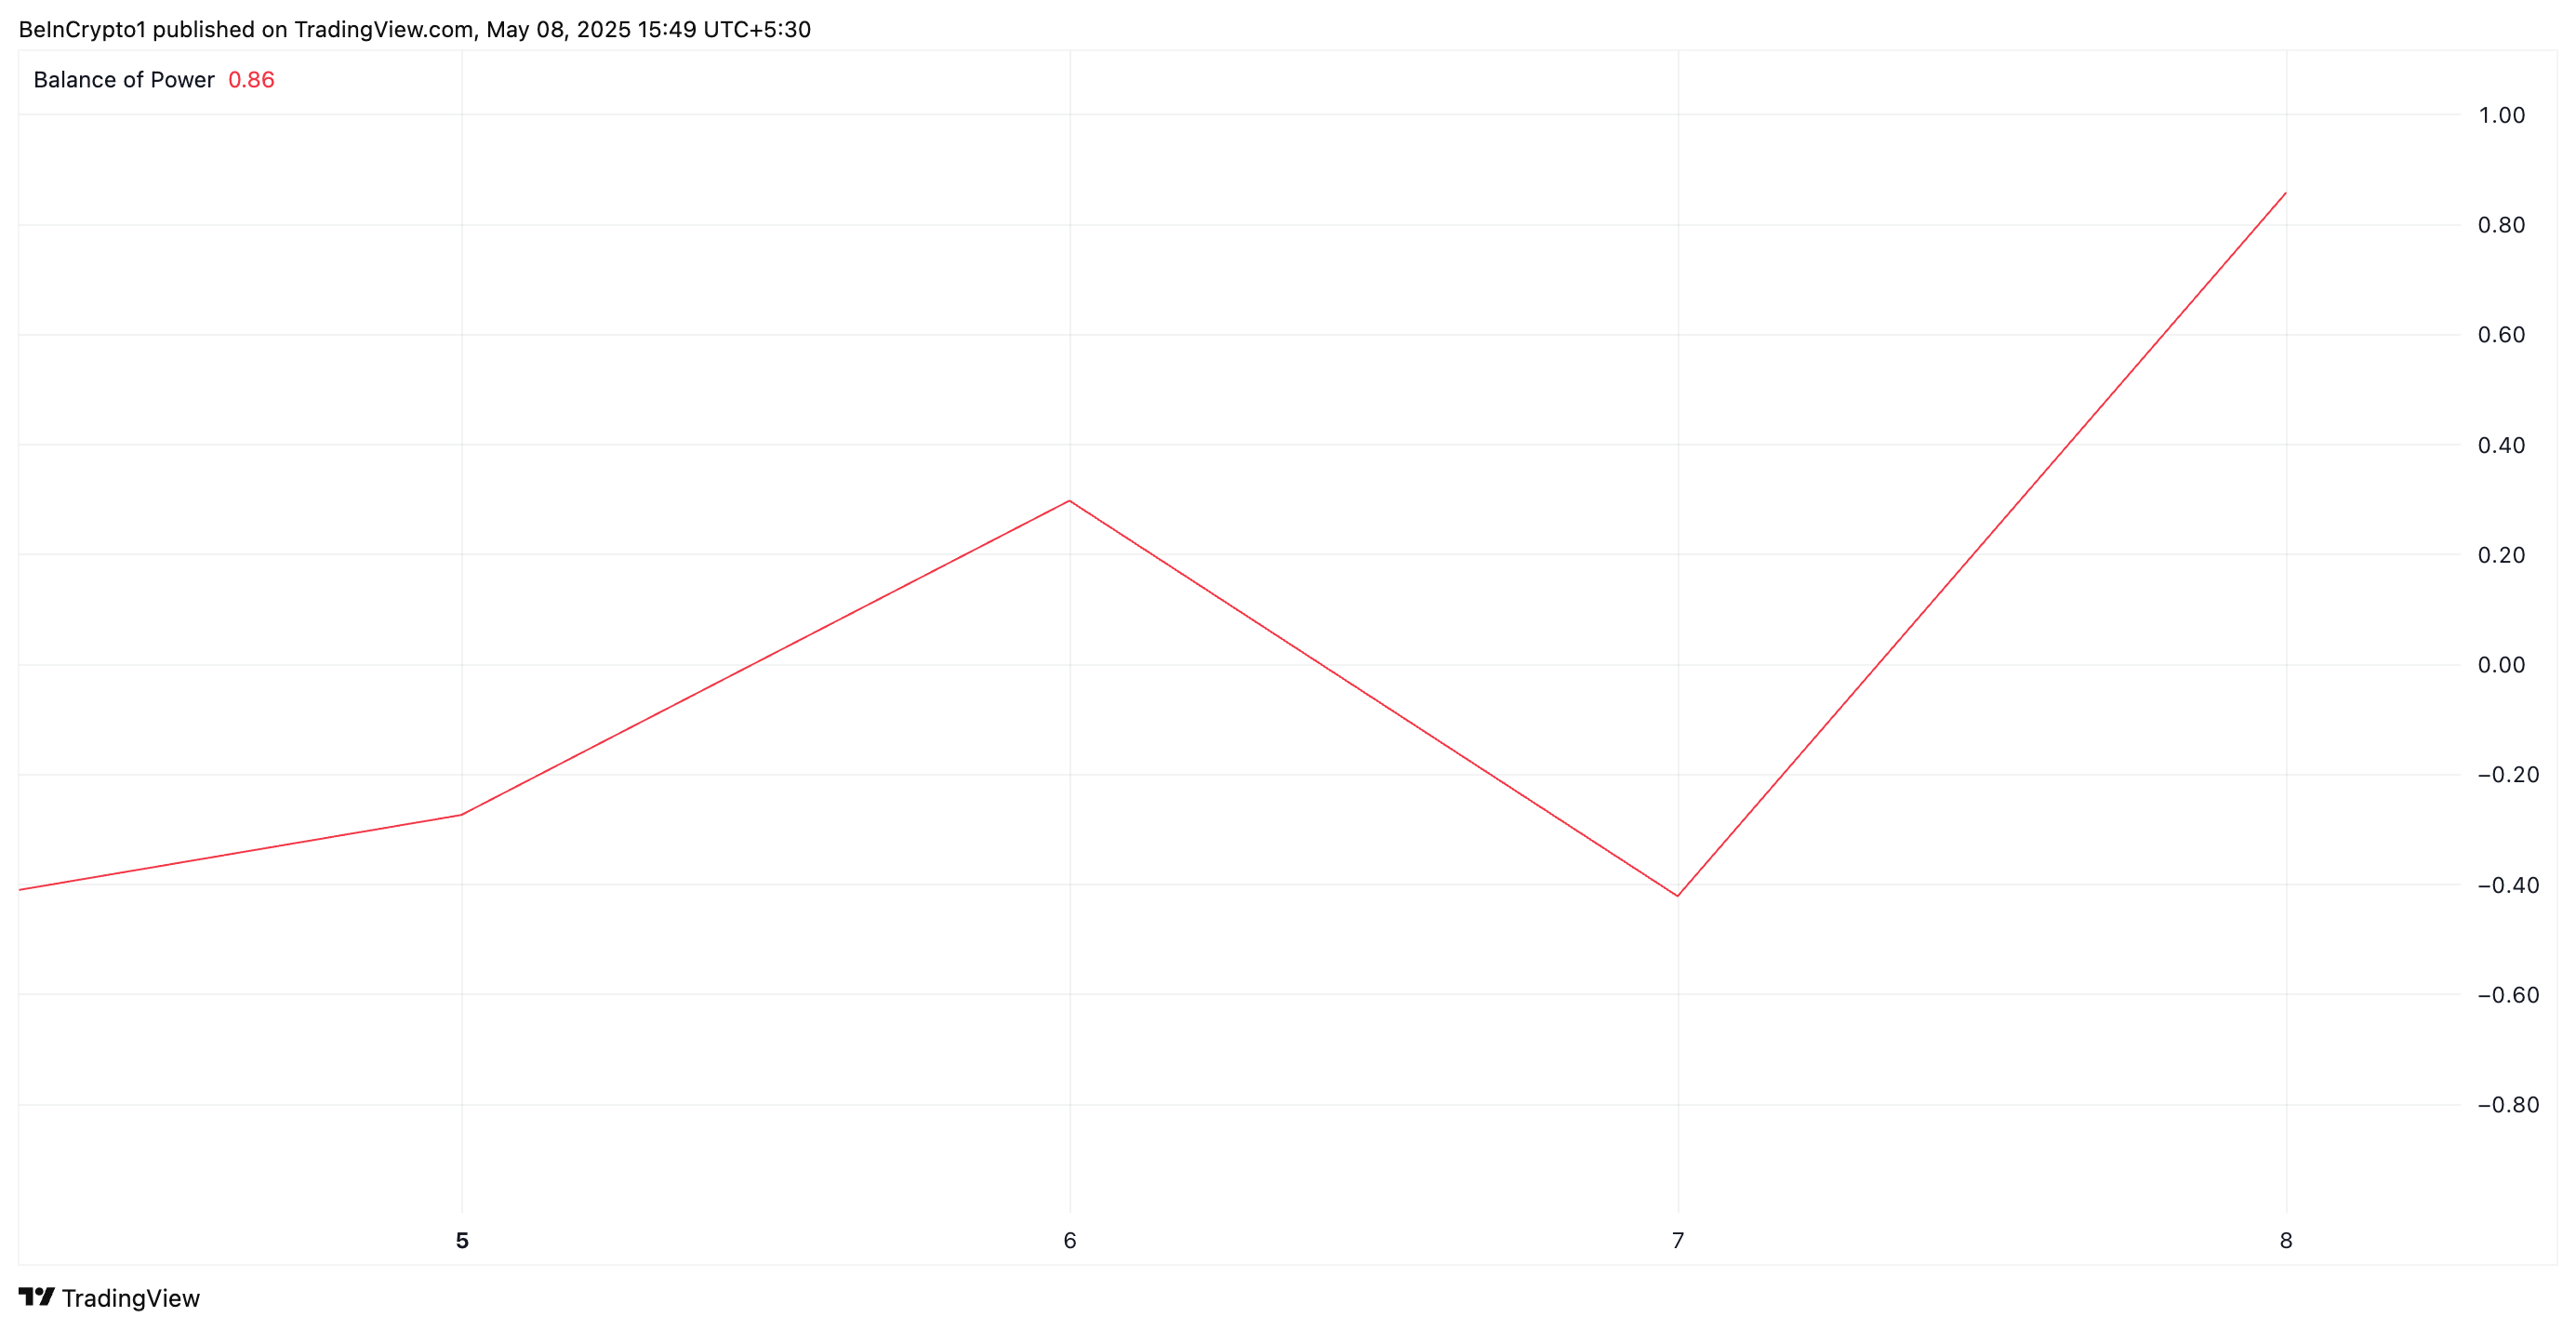 XRP BoP. Source:
TradingView
XRP BoP. Source:
TradingView
The BoP indicator measures the strength of buying versus selling pressure in an asset’s market. When it climbs this way, buyers dominate the spot markets. This indicates a potential bullish trend for the XRP token and suggests its upward momentum could continue.
XRP Bulls Eye $2.50 After Breakout
XRP rests solidly above the descending trend line at $2.21. If demand strengthens and the breakout sees more bullish momentum, it could drive the token’s price past the resistance at $2.29.
A successful breach of this price level could drive XRP to $2.50.
 XRP Price Analysis. Source:
TradingView
XRP Price Analysis. Source:
TradingView
However, if buying stalls and XRP’s retest of the breakout line fails, it could fall to $1.99.
Disclaimer: The content of this article solely reflects the author's opinion and does not represent the platform in any capacity. This article is not intended to serve as a reference for making investment decisions.
You may also like
Don't be fooled by the rebound! Bitcoin could retest the lows at any time | Special Analysis
Analyst Conaldo reviewed bitcoin’s market performance last week using a quantitative trading model, successfully executing two short-term trades with a total return of 6.93%. The forecast for this week is that bitcoin will continue to fluctuate within a range, and corresponding trading strategies have been formulated. Summary generated by Mars AI. The accuracy and completeness of this summary, generated by the Mars AI model, are still being updated and iterated.
Espresso co-founder’s decade in crypto: I wanted to disrupt Wall Street’s flaws, but witnessed a transformation into a casino instead
Everything you've been hoping for may have already arrived; it just looks different from what you expected.

Solana Foundation Steps In as Kamino and Jupiter Lend Dispute Intensifies

Bitcoin Firms Confront the Boomerang Effect of Excessive Leverage