PEPE Coin: Meme Rally Continues or Crash Risk Ahead?

As meme coins battle for spotlight once again, PEPE coin price is showing signs of a potential breakout —or a brewing correction. Let’s dive deep into both the hourly and daily TradingView charts of PEPE coin price to understand whether this rally is just getting started or standing on weak legs.
Pepe Coin Price Prediction: Is PEPE Losing Steam or Building for a Breakout?
 PEPE/USD 1 Hr chart- TradingView
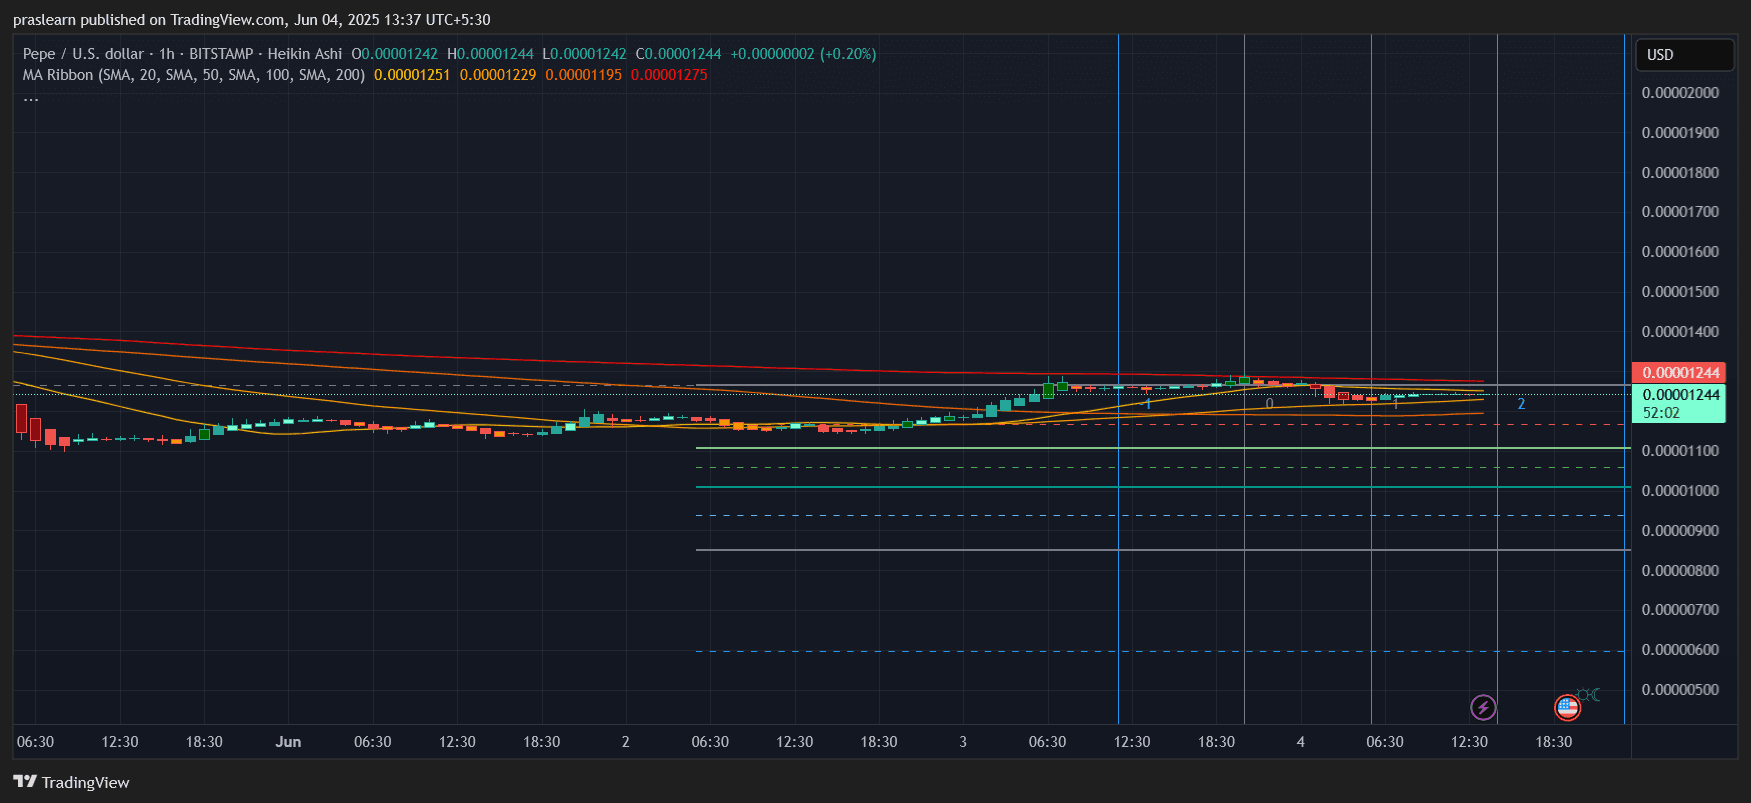
On the hourly chart, PEPE coin price is consolidating just under major resistance levels. The price is hovering around $0.00001244, with tight movement over the last 48 hours. What's notable is that the 20 SMA ($0.00001251) is acting as immediate overhead resistance, while 50 SMA ($0.00001229) is closely supporting the current zone. The 200 SMA, however, is still significantly higher around $0.00001275, suggesting that PEPE has room to climb if volume kicks in.
Despite this compression, Heikin Ashi candles are showing mild bullish bias with higher lows, but not enough momentum yet to break through the resistance cluster formed by the 20 and 200 SMAs.
So far, PEPE coin price has gained around +5.75% since bouncing from the support area near $0.00001175, but unless it breaks $0.00001275 convincingly, bulls might not see fireworks.
What Does the Daily Chart Reveal?
 PEPE/USD 1 Day chart- TradingView
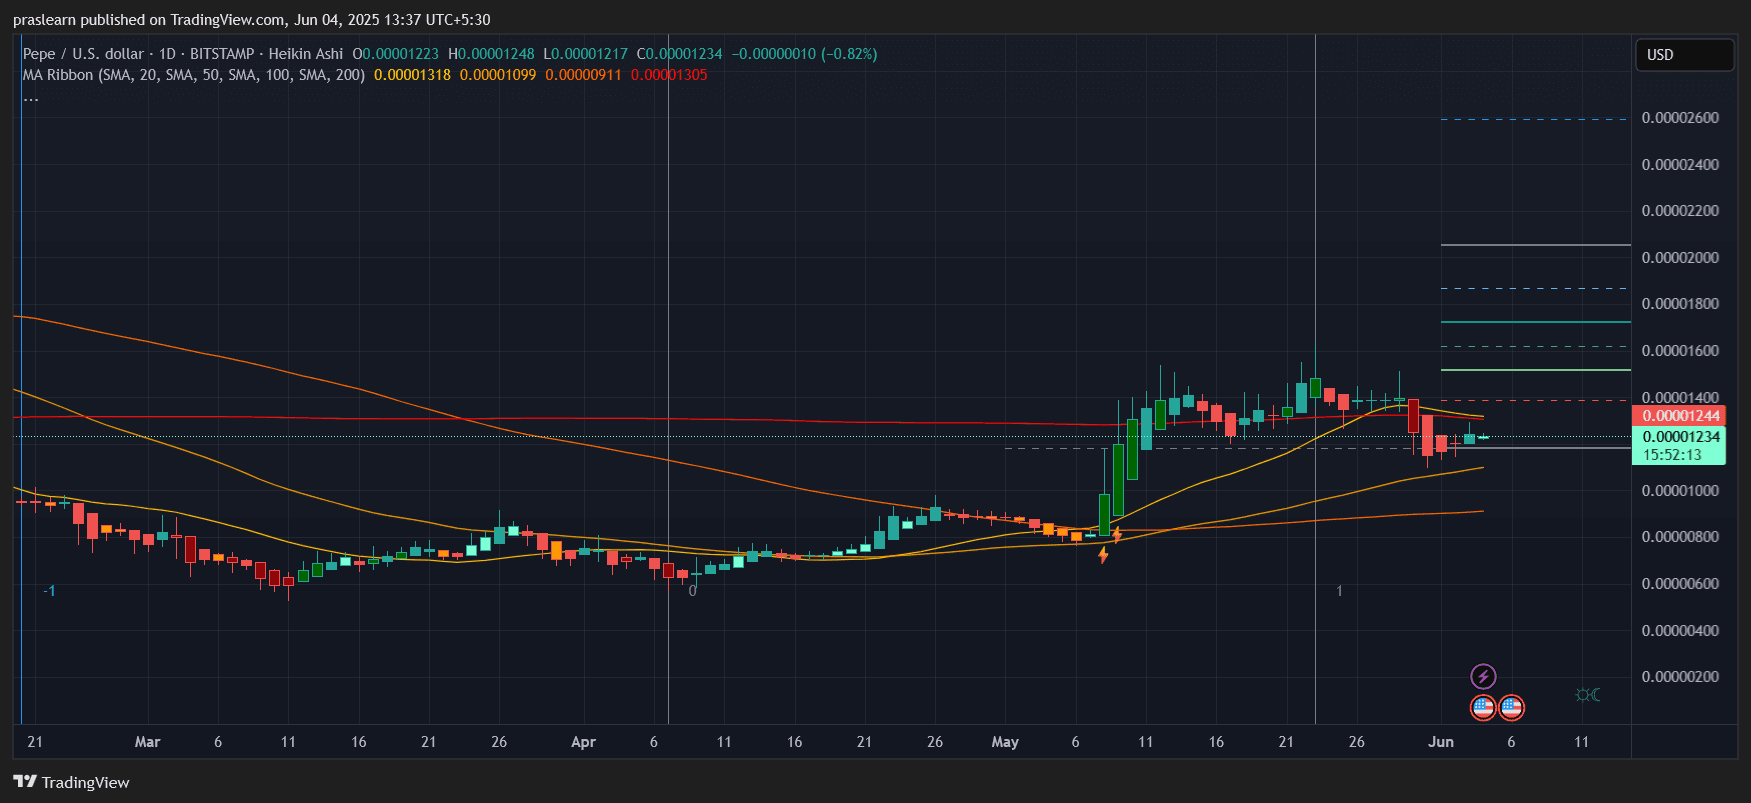
The daily chart tells a broader story. PEPE coin saw a strong impulse rally in early May, followed by a clear correction phase. Currently, the coin trades around $0.00001234, down -0.82% for the day, but still above the 50 SMA ($0.00001099) and well above the 100 SMA ($0.00000911), keeping its medium-term trend technically bullish.
We can calculate the rebound zone from the recent swing low near $0.00001000 to the recent high of $0.00001400, which gives us a Fib retracement level of 0.618 around $0.00001138. Interestingly, PEPE respected this level twice in late May, confirming it as a strong support zone.
The 20 SMA ($0.00001318) is still trending downward, so unless PEPE coin price closes above it soon , there's risk of another rejection. Bulls need a daily close above $0.00001350 to gain real confidence and chase higher resistance levels near $0.00001600 and $0.00001800.
For comprehensive exchange comparisons and detailed reviews, visit our exchange comparison guide to find the platform that best suits your altcoin investment needs
Key Levels to Watch and Final Pepe Coin Price Prediction
Short-term, the price remains range-bound. But if PEPE coin price breaks $0.00001275 with volume on the hourly, a test of $0.00001350 on the daily becomes likely. From there, the rally could extend to $0.00001600, which would be a +29% gain from current levels.
Conversely, failure to hold $0.00001220 might open the doors for a fall back to $0.00001100, and a break below that brings $0.00000950 into play—a nearly -25% downside.
With moving averages aligning and price consolidating at key levels, the next 48 hours are critical. A breakout above $0.00001275 signals strength. Until then, caution and tight stop-losses are key.
PEPE coin price is at a decision point . It’s neither a confirmed breakout nor a full crash yet. But the volatility is coming—be ready.
$PEPE, $Pepe
As meme coins battle for spotlight once again, PEPE coin price is showing signs of a potential breakout —or a brewing correction. Let’s dive deep into both the hourly and daily TradingView charts of PEPE coin price to understand whether this rally is just getting started or standing on weak legs.
Pepe Coin Price Prediction: Is PEPE Losing Steam or Building for a Breakout?
PEPE/USD 1 Hr chart- TradingView
On the hourly chart, PEPE coin price is consolidating just under major resistance levels. The price is hovering around $0.00001244, with tight movement over the last 48 hours. What's notable is that the 20 SMA ($0.00001251) is acting as immediate overhead resistance, while 50 SMA ($0.00001229) is closely supporting the current zone. The 200 SMA, however, is still significantly higher around $0.00001275, suggesting that PEPE has room to climb if volume kicks in.
Despite this compression, Heikin Ashi candles are showing mild bullish bias with higher lows, but not enough momentum yet to break through the resistance cluster formed by the 20 and 200 SMAs.
So far, PEPE coin price has gained around +5.75% since bouncing from the support area near $0.00001175, but unless it breaks $0.00001275 convincingly, bulls might not see fireworks.
What Does the Daily Chart Reveal?
PEPE/USD 1 Day chart- TradingView
The daily chart tells a broader story. PEPE coin saw a strong impulse rally in early May, followed by a clear correction phase. Currently, the coin trades around $0.00001234, down -0.82% for the day, but still above the 50 SMA ($0.00001099) and well above the 100 SMA ($0.00000911), keeping its medium-term trend technically bullish.
We can calculate the rebound zone from the recent swing low near $0.00001000 to the recent high of $0.00001400, which gives us a Fib retracement level of 0.618 around $0.00001138. Interestingly, PEPE respected this level twice in late May, confirming it as a strong support zone.
The 20 SMA ($0.00001318) is still trending downward, so unless PEPE coin price closes above it soon , there's risk of another rejection. Bulls need a daily close above $0.00001350 to gain real confidence and chase higher resistance levels near $0.00001600 and $0.00001800.
For comprehensive exchange comparisons and detailed reviews, visit our exchange comparison guide to find the platform that best suits your altcoin investment needs
Key Levels to Watch and Final Pepe Coin Price Prediction
Short-term, the price remains range-bound. But if PEPE coin price breaks $0.00001275 with volume on the hourly, a test of $0.00001350 on the daily becomes likely. From there, the rally could extend to $0.00001600, which would be a +29% gain from current levels.
Conversely, failure to hold $0.00001220 might open the doors for a fall back to $0.00001100, and a break below that brings $0.00000950 into play—a nearly -25% downside.
With moving averages aligning and price consolidating at key levels, the next 48 hours are critical. A breakout above $0.00001275 signals strength. Until then, caution and tight stop-losses are key.
PEPE coin price is at a decision point . It’s neither a confirmed breakout nor a full crash yet. But the volatility is coming—be ready.
$PEPE, $Pepe
Disclaimer: The content of this article solely reflects the author's opinion and does not represent the platform in any capacity. This article is not intended to serve as a reference for making investment decisions.
You may also like
As economic cracks deepen, bitcoin may become the next liquidity "release valve"
The US economy is showing a divided state, with financial markets booming while the real economy is declining. The manufacturing PMI continues to contract, yet the stock market is rising due to concentrated profits in technology and financial companies, resulting in balance sheet inflation. Monetary policy struggles to benefit the real economy, and fiscal policy faces difficulties. The market structure leads to low capital efficiency, widening the gap between rich and poor and increasing social discontent. Cryptocurrency is seen as a relief valve, offering open financial opportunities. The economic cycle oscillates between policy adjustments and market reactions, lacking substantial recovery. Summary generated by Mars AI. The accuracy and completeness of this summary are still being iteratively updated by the Mars AI model.

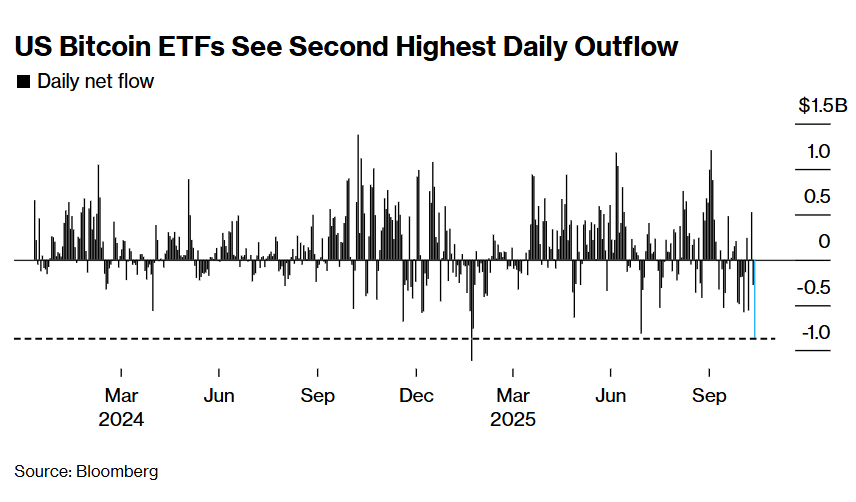
The wave of cryptocurrency liquidations continues! US Bitcoin ETF sees second highest single-day outflow in history
Due to the reassessment of Federal Reserve rate cut expectations and the fading rebound of the U.S. stock market, the crypto market continues to experience liquidations, with significant ETF capital outflows and options traders increasing bets on volatility. Institutions warn that technical support for bitcoin above $90,000 is weak.
When traditional financial markets fail, will the crypto industry become a "pressure relief valve" for liquidity?
As long as the system continues to recycle debt into asset bubbles, we will not see a true recovery—only a slow stagnation masked by rising nominal figures.
A Quiet End to 2025 Could Prime Crypto for a 2026 Breakout, Analysts Say