

Date: Wed, Nov 12, 2025 | 09:40 AM GMT
The cryptocurrency market is displaying mixed sentiment today as both Bitcoin (BTC) and Ethereum (ETH) trade slightly in red, with Ethereum slipping around 2%. This has put mild pressure on several altcoins — including Celestia (TIA) — which is trading modestly lower on the day.
However, despite the short-term pullback, TIA’s latest chart formation is flashing a potential bullish signal. A key accumulation-based structure known as the “Power of 3” pattern appears to be forming, suggesting that smart money could be positioning for a possible upside expansion.
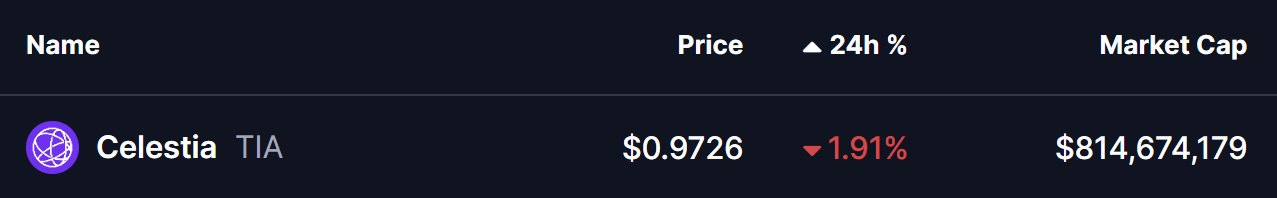 Source: Coinmarketcap
Power of 3 in Play?
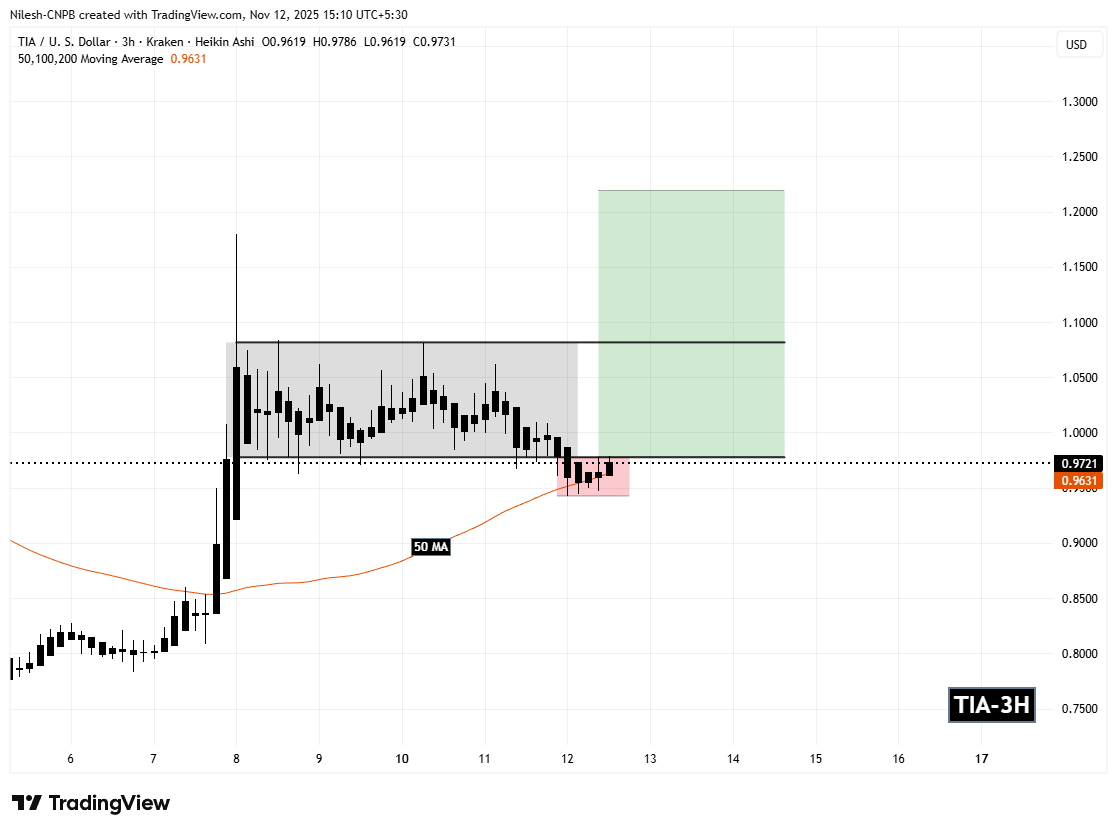
Looking closely at the 3-hour chart, TIA seems to be shaping a textbook Power of 3 structure — a concept often used by institutional traders to describe market cycles that progress through Accumulation, Manipulation, and Expansion phases.
Accumulation Phase
In early November, TIA traded in a tight sideways range between $1.0812 and $0.9783. This consolidation zone, highlighted in grey on the chart, indicates a typical accumulation area where buyers gradually build positions before a potential breakout.
Manipulation Phase
On Nov 11, TIA sharply broke below the accumulation zone, hitting a local low around $0.9429. This move likely represented a manipulation or “stop-hunt” phase, shaking out late buyers and triggering stop-loss orders before a trend reversal. Interestingly, the price quickly rebounded from that level, hinting that liquidity may have been collected for the next directional move.
 Celestia (TIA) 3H Chart/Coinsprobe (Source: Tradingview)
What’s Next for TIA?
Currently, TIA is hovering just under the lower boundary of its former range, around $0.9721, while holding above the 50-period moving average ($0.9631) — a key dynamic support line that adds confidence to the bullish bias.
If TIA can reclaim $0.9783, it would confirm that the manipulation phase has likely concluded and the expansion phase — the final leg of the Power of 3 — is underway. From there, bullish momentum could lift the token toward $1.2195, aligning with the upper resistance zone and representing a potential 25% upside from current prices.
On the flip side, if TIA fails to hold above $0.9429, it would invalidate the bullish pattern, potentially leading to further corrective movement before another accumulation phase can form.