The crypto markets are experiencing one of the deadliest bloodbaths, with the Bitcoin price plunging below the psychological barrier at $100K . This was believed to drag the altcoins lower, but they continue to display strength . Ethereum, the second-largest token, continues to defend the $3000 support level, but the question arises, till when? The BTC price has been plunging heavily, which raises the possibility of the ETH price testing the support at $2900.
Ethereum continues to trade above the $3,000 level, showing relatively stable price action despite broader market turbulence. The daily chart reflects a tightening structure, with the ETH price forming higher lows over the past week while repeatedly testing the $3,050–$3,100 zone. This area has now become the immediate support range to watch. On the upside, price remains capped below $3,250, where sell orders have consistently absorbed attempts to break higher.
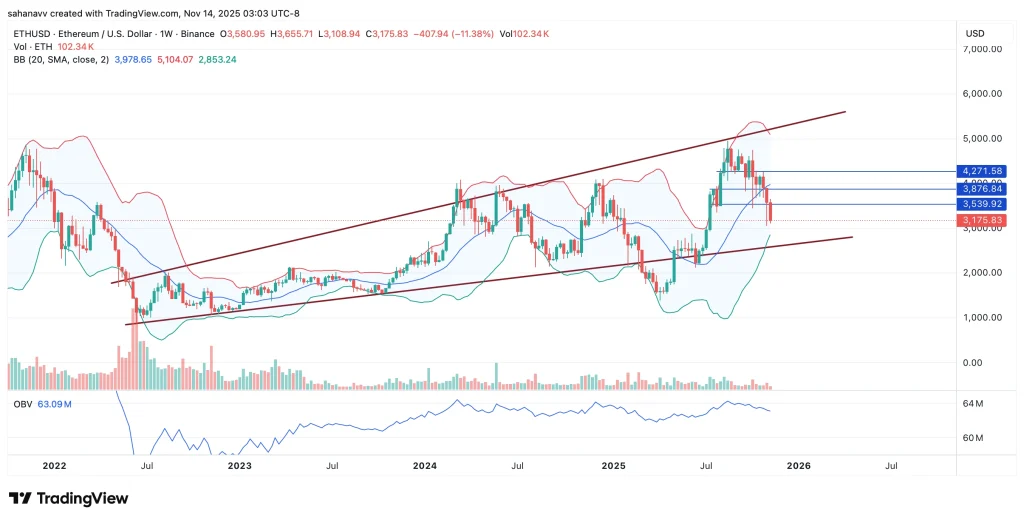
Ethereum is trading near $3,175, sitting on a key weekly support within its long-term ascending channel. The Bollinger Bands are tightening, signaling a volatility squeeze that often precedes a sharp directional move. At the same time, the plunging OBV reflects weakening buying pressure, increasing the risk of a breakdown. If ETH rebounds, upside targets sit at $3,540, $3,876, and $4,271. Failure to hold this level may drag the price toward $2,850, the lower band and trendline support.
- Also Read :
- How Low Can Bitcoin Price Go? Analysts Point to Two Key Levels
- ,
Ethereum’s ability to hold above $3,000, even as broader market sentiment weakens, keeps its medium-term structure intact. The weekly chart shows ETH clinging to a critical support zone, with upcoming moves likely to be driven by volatility around major technical levels. A rebound toward $3,540 and $3,876 remains possible if buyers maintain pressure, while a breakdown below $3,175 could shift momentum decisively bearish. With Bitcoin still unstable, ETH traders should stay alert to strong reactions at these key zones.