Bitcoin's key signal flashes: historical data suggests a violent rise in 3-4 months
TechDev2024/12/17 09:59
By:TechDev
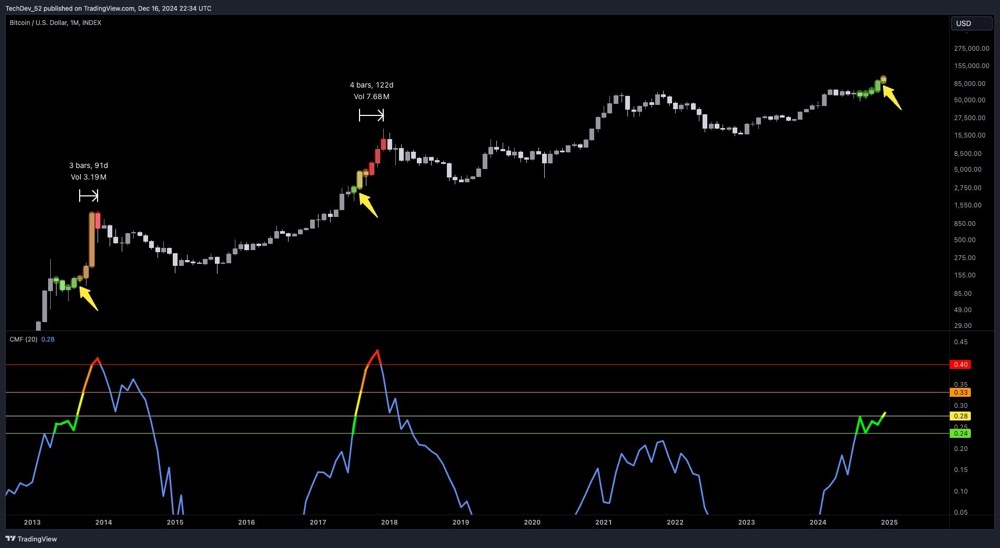
On-chain analyst TechDev pointed out that the Chaikin Money Flow indicator (CMF) of Bitcoin has touched the "yellow area". From historical data, this key signal appeared in the bull markets of 2013 and 2017, followed by a vertical rise in Bitcoin prices within 3-4 months, with astonishing gains.
Specifically:
In 2013, after the capital flow touched the yellow area, Bitcoin achieved a strong rise in 91 days, with a significant increase in trading volume.
In 2017, similar signals appeared again, and the price of BTC exploded in 122 days, with trading volume soaring to a high.
Currently, the CMF of BTC has re-entered this area. With the gradual recovery of market liquidity and the strengthening of trading volume support, resonance signals between Technical Fundamental and Fundamental have begun to emerge. If historical patterns repeat, the price of Bitcoin may enter a new round of strong upward trend in the next 3-4 months.
1
1
Disclaimer: The content of this article solely reflects the author's opinion and does not represent the platform in any capacity. This article is not intended to serve as a reference for making investment decisions.
You may also like
Best Meme Coins to Buy – Pudgy Penguins Price Prediction
Cryptonomist•2025/12/21 11:12

Bitcoin holds $85K despite miner stress – Is ‘buy the fear’ back?
AMBCrypto•2025/12/21 11:03

Analyst Sends Critical Warning to XRP Holders: Largest Bear Trap In History
TimesTabloid•2025/12/21 11:03
Shiba Inu Targets 25x, Yet Ozak AI Prediction Leans Toward a Triple-Digit Run
Cryptodaily•2025/12/21 11:00