
DOT Price (Polkadot) Holds Strong At $6.6, Signs Point To Fresh Rally Ahead
Polkadot (DOT) is correcting gains from the $7.75 against the US Dollar. The price could start a fresh increase unless there is a close below $6.30.
- DOT is consolidating gains above the $6.60 support zone against the US Dollar.
- The price is trading above the $6.65 zone and the 100 simple moving average (4 hours).
- There is a key bullish trend line forming with support near $6.65 on the 4-hour chart of the DOT/USD pair (data source from Kraken).
- The pair could start a fresh increase if the bulls protect the $6.65 and $6.30 support levels.
PolkaDOT price Holds Ground
After forming a base above the $5.50 support, DOT price started a decent increase. The price was able to clear the $5.85 and $6.00 resistance levels to move into a positive zone, like Bitcoin and Ethereum.
Polkadot even surpassed the $6.65 resistance zone and settled above the 100 simple moving average (4 hours). Finally, the bears appeared near the $7.75 zone. A high was formed near $7.77 and the price is now correcting gains. There was a drop below the $7.20 and $7.00 levels.
DOT declined below the 61.8% Fib retracement level of the upward move from the $6.31 swing low to the $7.77 high. However, it is still above the $6.65 zone and the 100 simple moving average (4 hours).
There is also a key bullish trend line forming with support near $6.65 on the 4-hour chart of the DOT/USD pair. The trend line is close to the 76.4% Fib retracement level of the upward move from the $6.31 swing low to the $7.77 high.
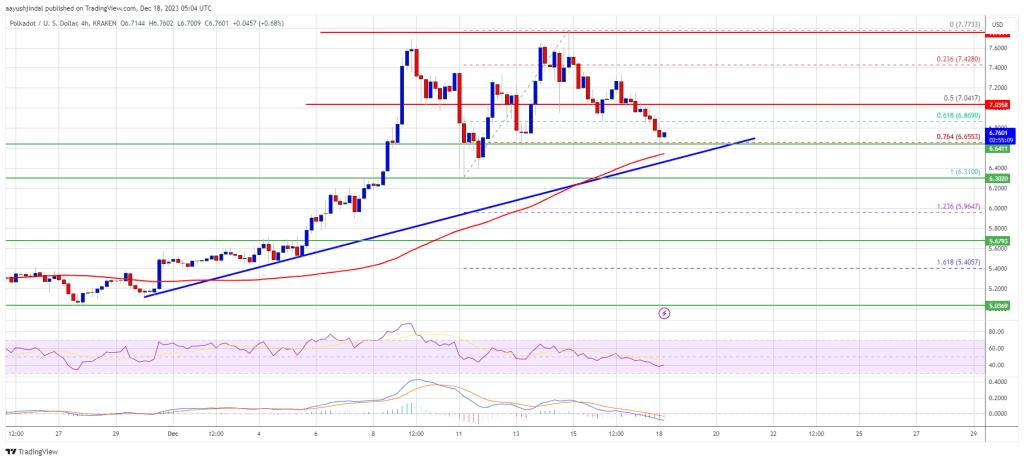
Source: DOTUSD on TradingView.com
Immediate resistance is near the $7.05 level. The next major resistance is near $7.20. A successful break above $7.20 could start another strong rally. In the stated case, the price could easily rally toward $7.75 in the near term. The next major resistance is seen near the $8.00 zone.
More Losses in DOT?
If DOT price fails to start a fresh increase above $7.05, it could continue to move down. The first key support is near the $6.65 level and the trend line.
The next major support is near the $6.30 level, below which the price might decline to $5.70. Any more losses may perhaps open the doors for a move toward the $5.00 support zone.
Technical Indicators
4-Hours MACD – The MACD for DOT/USD is now gaining momentum in the bearish zone.
4-Hours RSI (Relative Strength Index) – The RSI for DOT/USD is now below the 50 level.
Major Support Levels – $6.65, $6.30 and $5.70.
Major Resistance Levels – $7.05, $7.20, and $7.75.
Disclaimer: The content of this article solely reflects the author's opinion and does not represent the platform in any capacity. This article is not intended to serve as a reference for making investment decisions.
You may also like
No wonder Buffett finally bet on Google
Google holds the entire chain in its own hands. It does not rely on Nvidia and possesses efficient, low-cost computational sovereignty.
HYPE Price Prediction December 2025: Can Hyperliquid Absorb Its Largest Supply Shock?

XRP Price Stuck Below Key Resistance, While Hidden Bullish Structure Hints at a Move To $3
Bitcoin Price Prediction: Recovery Targets $92K–$101K as Market Stabilizes