Bitcoin ( BTC ) is rapidly headed for “oversold” territory despite still trading above $40,000, the latest data shows.
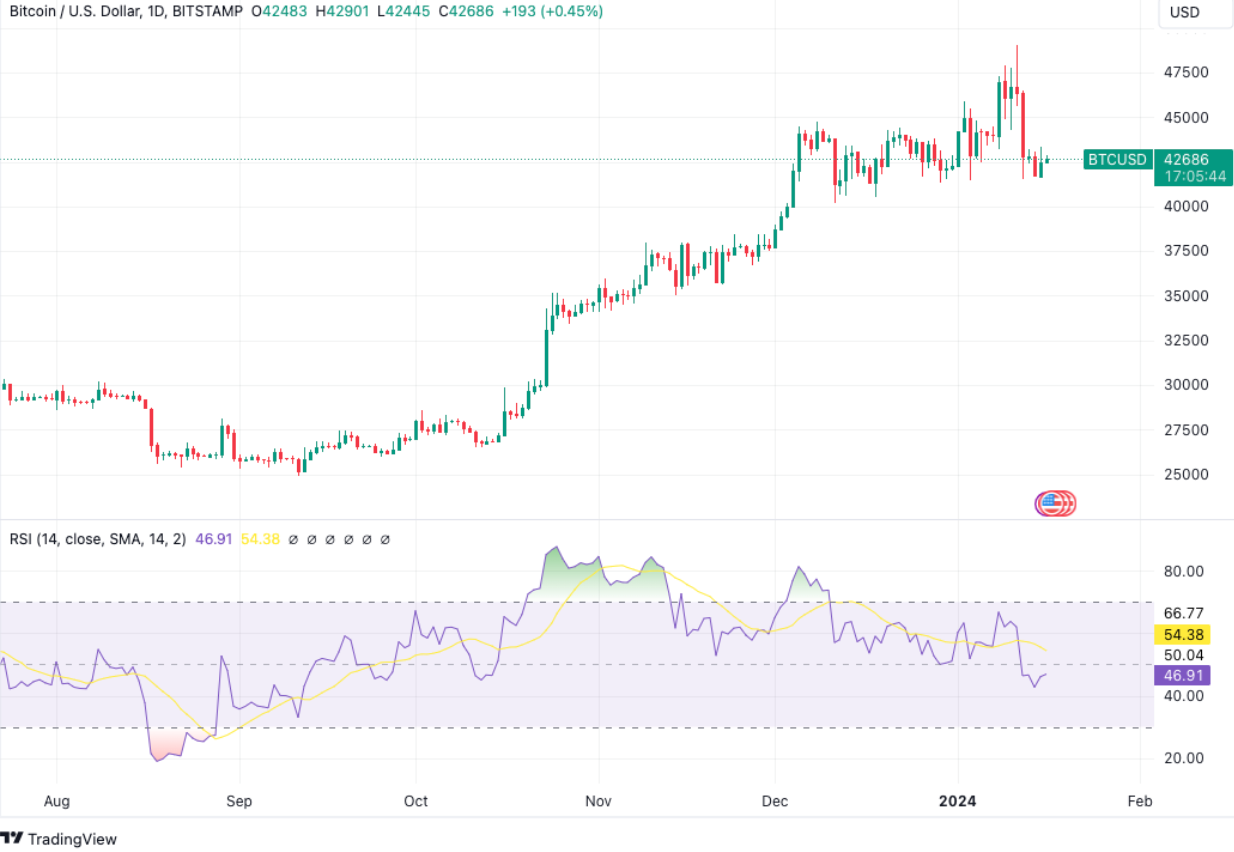
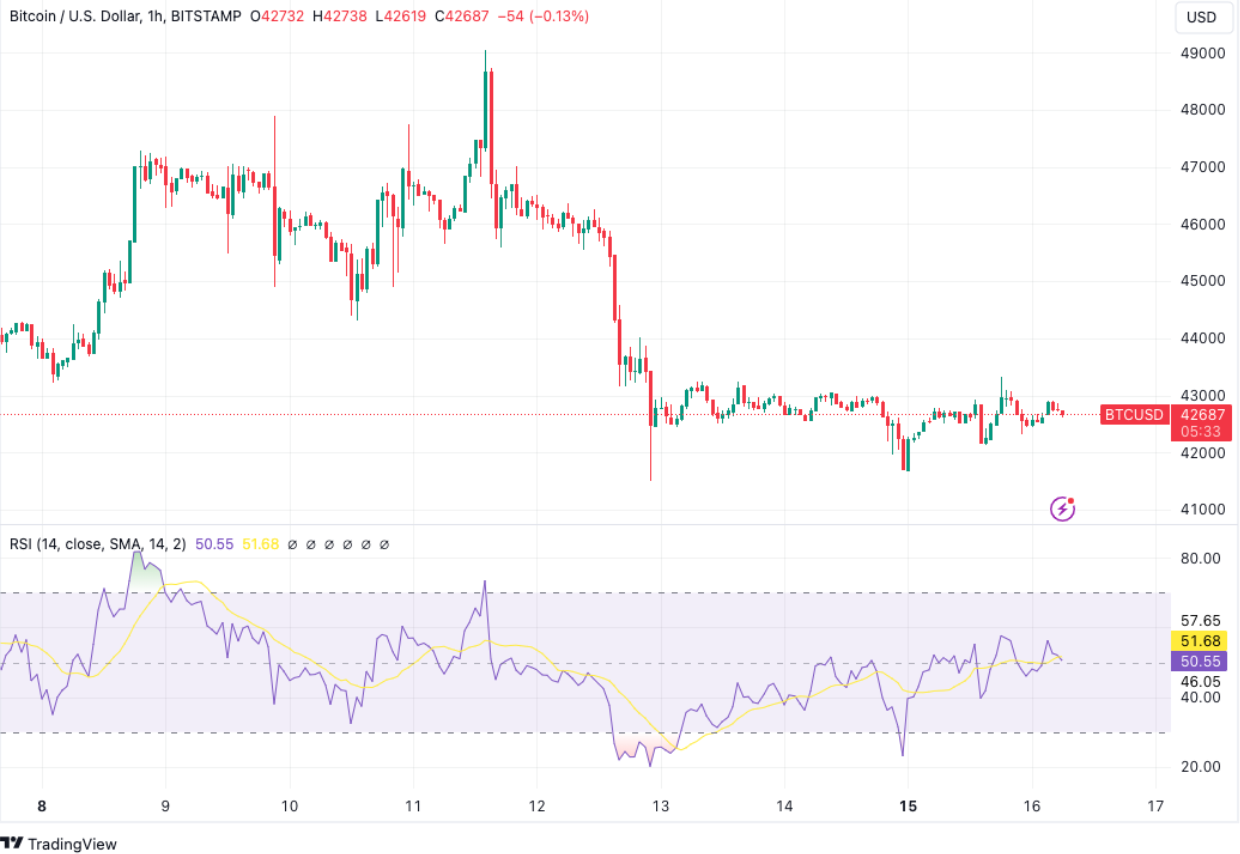
As noted by analyst Matthew Hyland on Jan. 14, Bitcoin’s relative strength index ( RSI ) hit its lowest levels since September this week.
BTC price RSI echoes $25,000 levels
BTC price performance suffered a 15% drop after the launch of the United States’ first spot Bitcoin exchange-traded funds (ETFs) — and has so far struggled to bounce back .
As traders warn of the risk of further downside, RSI is showing that a reversal may already be near.
On daily timeframes, the classic momentum oscillator dipped to 42.7/100 on Jan. 14 — lower than at any point in the last four months, as confirmed by data from Cointelegraph markets Pro and TradingView .
At the time, BTC/USD traded at around $25,000.

The move was not lost on Hyland, who uploaded a chart to X (formerly Twitter) which suggested a hidden bearish divergence playing out — RSI making lower lows while Bitcoin itself makes higher lows.
#BTC Daily RSI lower that October lows and at lowest levels since September: pic.twitter.com/lwPnkrhkUh
— Matthew Hyland (@MatthewHyland_) January 16, 2024
Daily RSI is nonetheless not strictly indicative of an imminent return to form for BTC price strength.
Having sunk below the midpoint of 50/100, the metric’s next major test could be the barrier to its “oversold” area at 30/100.
“I would like to see the Daily RSI go down to Oversold for Bitcoin,” popular trader and social media commentator Seth wrote in part of a recent X post.


