
Bitcoin (BTC) Price Consolidation, Ethereum (ETH) Predictions After ETF Approvals, and More: Bits Recap May 27

BTC and ETH were predicted to peak in the near future, while XRP appears to be awaiting developments on the Ripple v. SEC front.
TL;DR
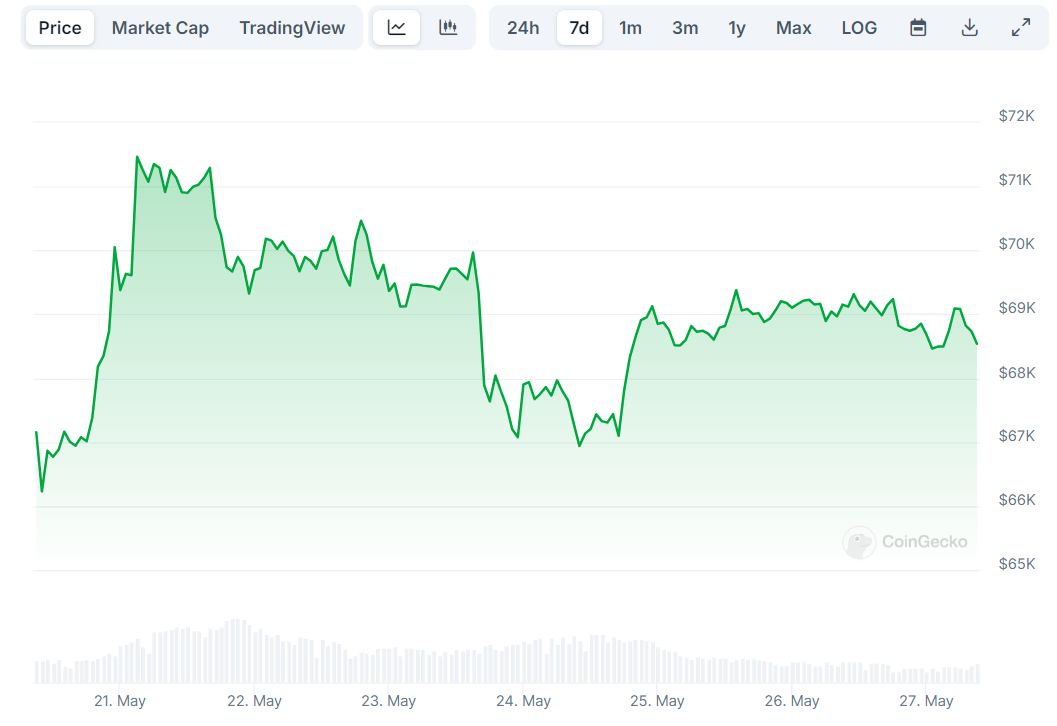
- BTC experienced volatility last week but calmed and currently sits around $68,500, with some analysts forecasting new ATHs.
- Despite a brief drop, ETH has rebounded and is trading above $3,900, a 36% increase over two weeks. Analysts anticipate further rallies, especially if the asset maintains momentum above key levels.
- XRP may also head north, influenced by technical indicators and ongoing legal proceedings with the SEC.
How’s BTC Doing?
The primary cryptocurrency experienced enhanced volatility in the past few weeks, rising from around $61,000 on May 14 to over $71,000 on May 21. The rally was stopped by a price correction, which pushed the asset below the $67K mark on May 24. Shortly after, though, BTC reclaimed some lost ground and has been trading in the $68,500-$69,300 area since then.
Despite the ongoing stagnation, numerous analysts believe the asset remains in a bullish mode, expecting substantial gains in the near future. One example is the X user Titan of Crypto who argued that a “breakout” is incoming once BTC surpassed the resistance zone of around $69,000.
Prior to that, the analyst analyzed Fibonacci extensions on the asset’s price chart to predict a new all-time high in the range of $173,000 to $224,000.
Such extensions are specific tools used in technical analysis to forecast potential future value targets based on the Fibonacci sequence. They could help traders identify key levels to watch for possible price swings, thereby aiding in better decision-making.
What About ETH?
The second-largest digital asset in terms of market capitalization – Ethereum – has become one of the hottest topics in the cryptocurrency space recently. Its price jumped from $3,100 on May 21 to over $3,900 on May 23 after reemerged hopes that the United States Securities and Exchange Commission (SEC) may approve spot ETH ETFs.
The official green light occurred on May 24, following which the asset’s value plunged below $3,700. Nonetheless, the bulls stepped in over the weekend, with ETH currently trading at approximately $3,910 (per CoinGecko’s data), a 4% daily increase and a 36% rise over two weeks.
Many analysts believe the asset’s price is yet to start a substantial rally. The X user Rekt Capital noted that ETH “spent plenty of time” around the $2,791 level, which historically has led to an uptick towards $4,000. The analyst outlined their prediction on May 26, arguing that a weekly close in the $3,250-$3,500 range “will confirm that bulls have reclaimed momentum.” Recall that ETH closed the week well above the depicted level.
XRP Price Outlook
Ripple’s native cryptocurrency has also witnessed some price volatility in the past week, hovering between $0.50 and $0.54, currently standing at around $0.52 (CoinGecko’s data).
While the asset is up a mere 2% on a 30-day scale, multiple analysts anticipate a bull run in the following months. One example is JAVON MARKS, who suggested that a bullish breakout is in the cards due to XRP nearing “a major converging point” and “an RSI Pattern that is currently indicating underlying momentum in prices.”
The Relative Strength Index (RSI) is an indicator measuring the speed and change of price movements. An RSI above 70 signals that the coin could be overbought and due for a price correction. Latest data shows that the ratio has been on a downfall in the last week, currently pointing at 41.
Disclaimer: The content of this article solely reflects the author's opinion and does not represent the platform in any capacity. This article is not intended to serve as a reference for making investment decisions.
You may also like
Ethereum Whales Dump Millions in ETH as Retail Investors Fight Back
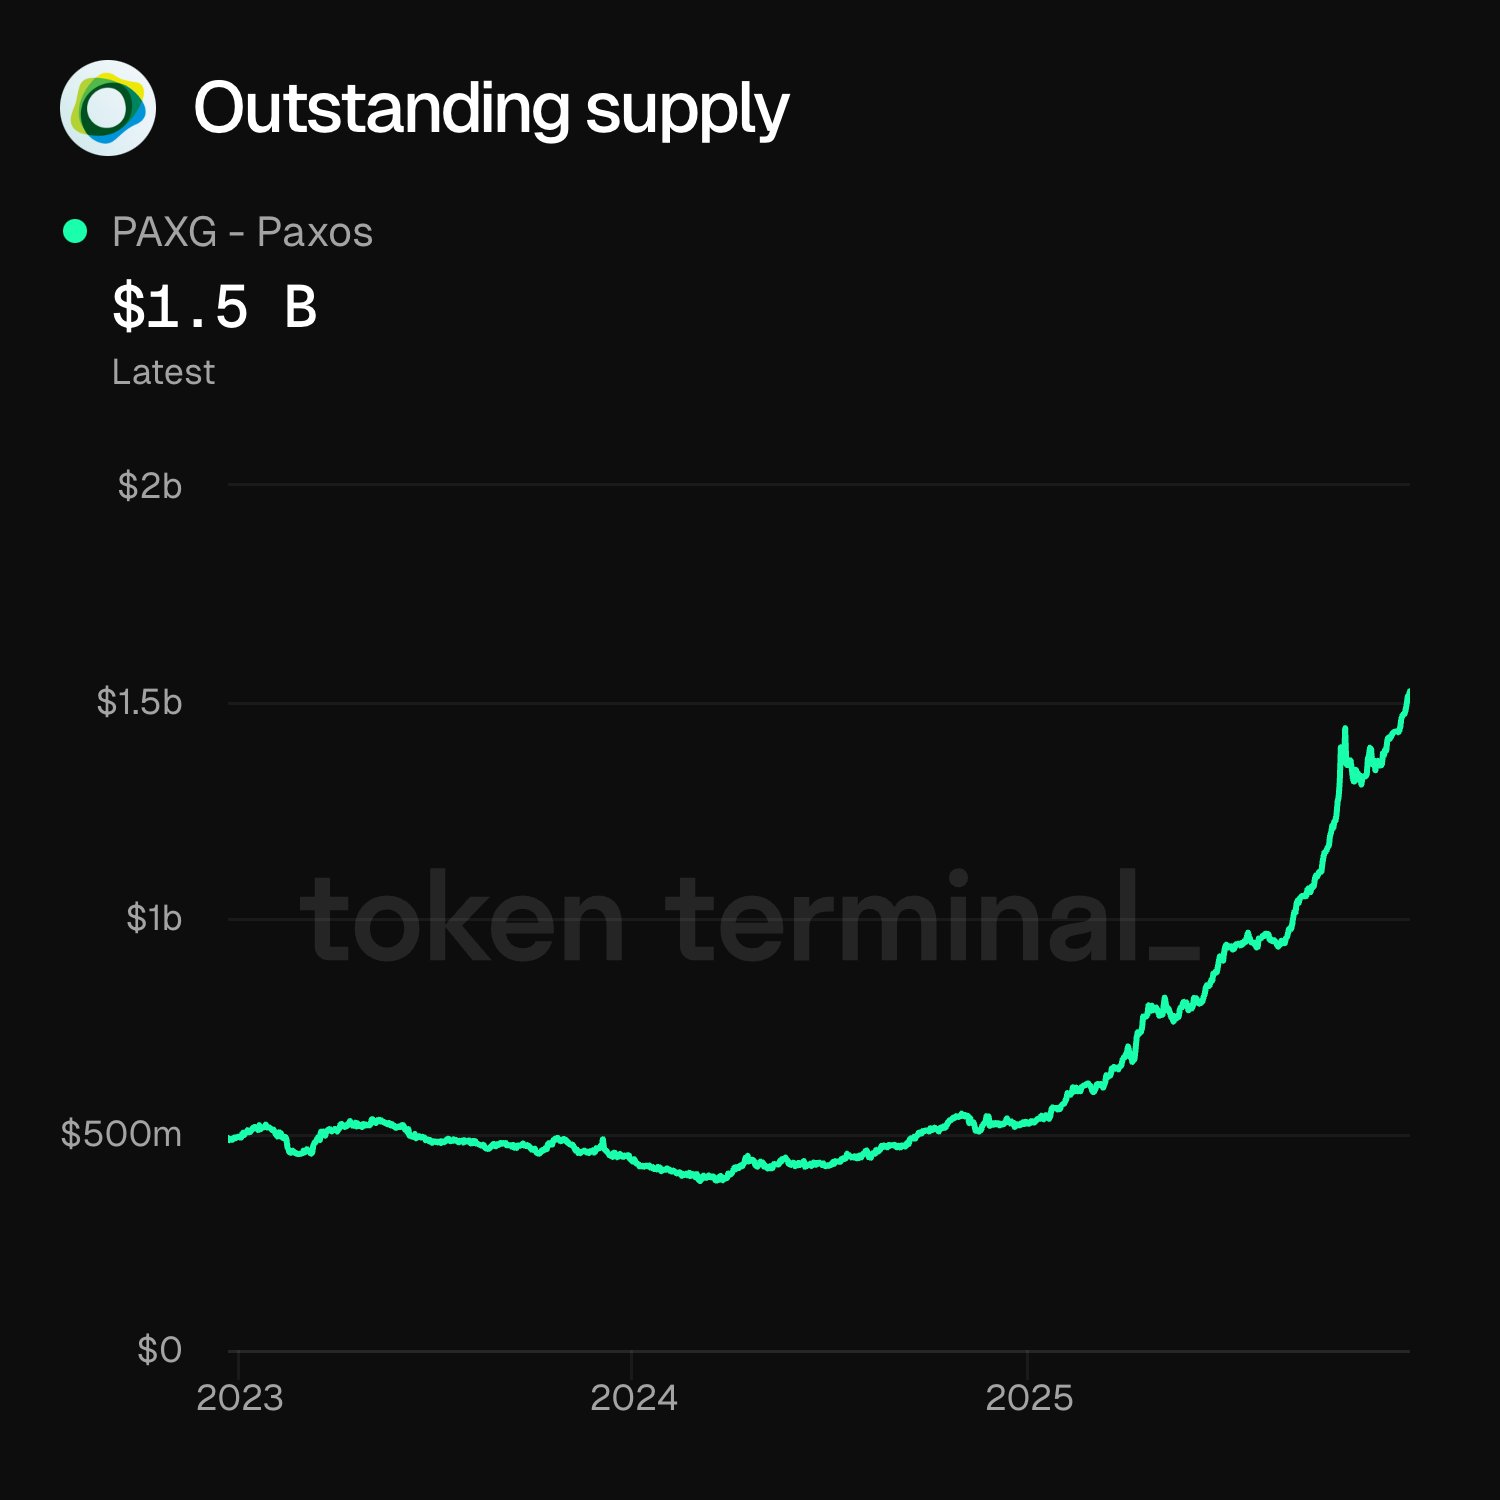
$1.5B flows into tokenized gold – Are investors abandoning Bitcoin?
Seek Protocol Joins Forces with ICB Network to Enhance Network Scalability, Advance Cross-Chain Benefits to Users