
Bitcoin spot trading volume data shows huge buying pressure before halving
The cumulative volume delta (CVD) data for Bitcoin spot trading shows significant trading behavior across various exchanges. At the beginning of 2024, there was a noticeable buying pressure, which correlates with the historical high point of Bitcoin in March. This surge could be attributed to increased investor confidence following the launch of a spot Bitcoin ETF in January and growing institutional interest, which are major drivers of recent market trends. After halving, CVD indicates fluctuating trade volumes with occasional spikes in buying activity; however, the market also experienced substantial selling pressure, particularly in May and June. This selling pressure coincides with regulatory developments in major markets that affected investor sentiment and led to temporary price corrections. Historically speaking, long-term CVD charts show periods of active buying and selling activities consistent with Bitcoin's price cycles. The large purchase volumes at the end of 2020 and early 2021 followed by sell-offs during 2022 highlight cyclical market behaviors. Current trends suggest that while Bitcoin may face short-term volatility, underlying buying pressures could support its long-term bullish outlook.
Disclaimer: The content of this article solely reflects the author's opinion and does not represent the platform in any capacity. This article is not intended to serve as a reference for making investment decisions.
You may also like
Analyst: Bitcoin Can Continue to Rise Without Waiting for Gold and Silver to Pull Back
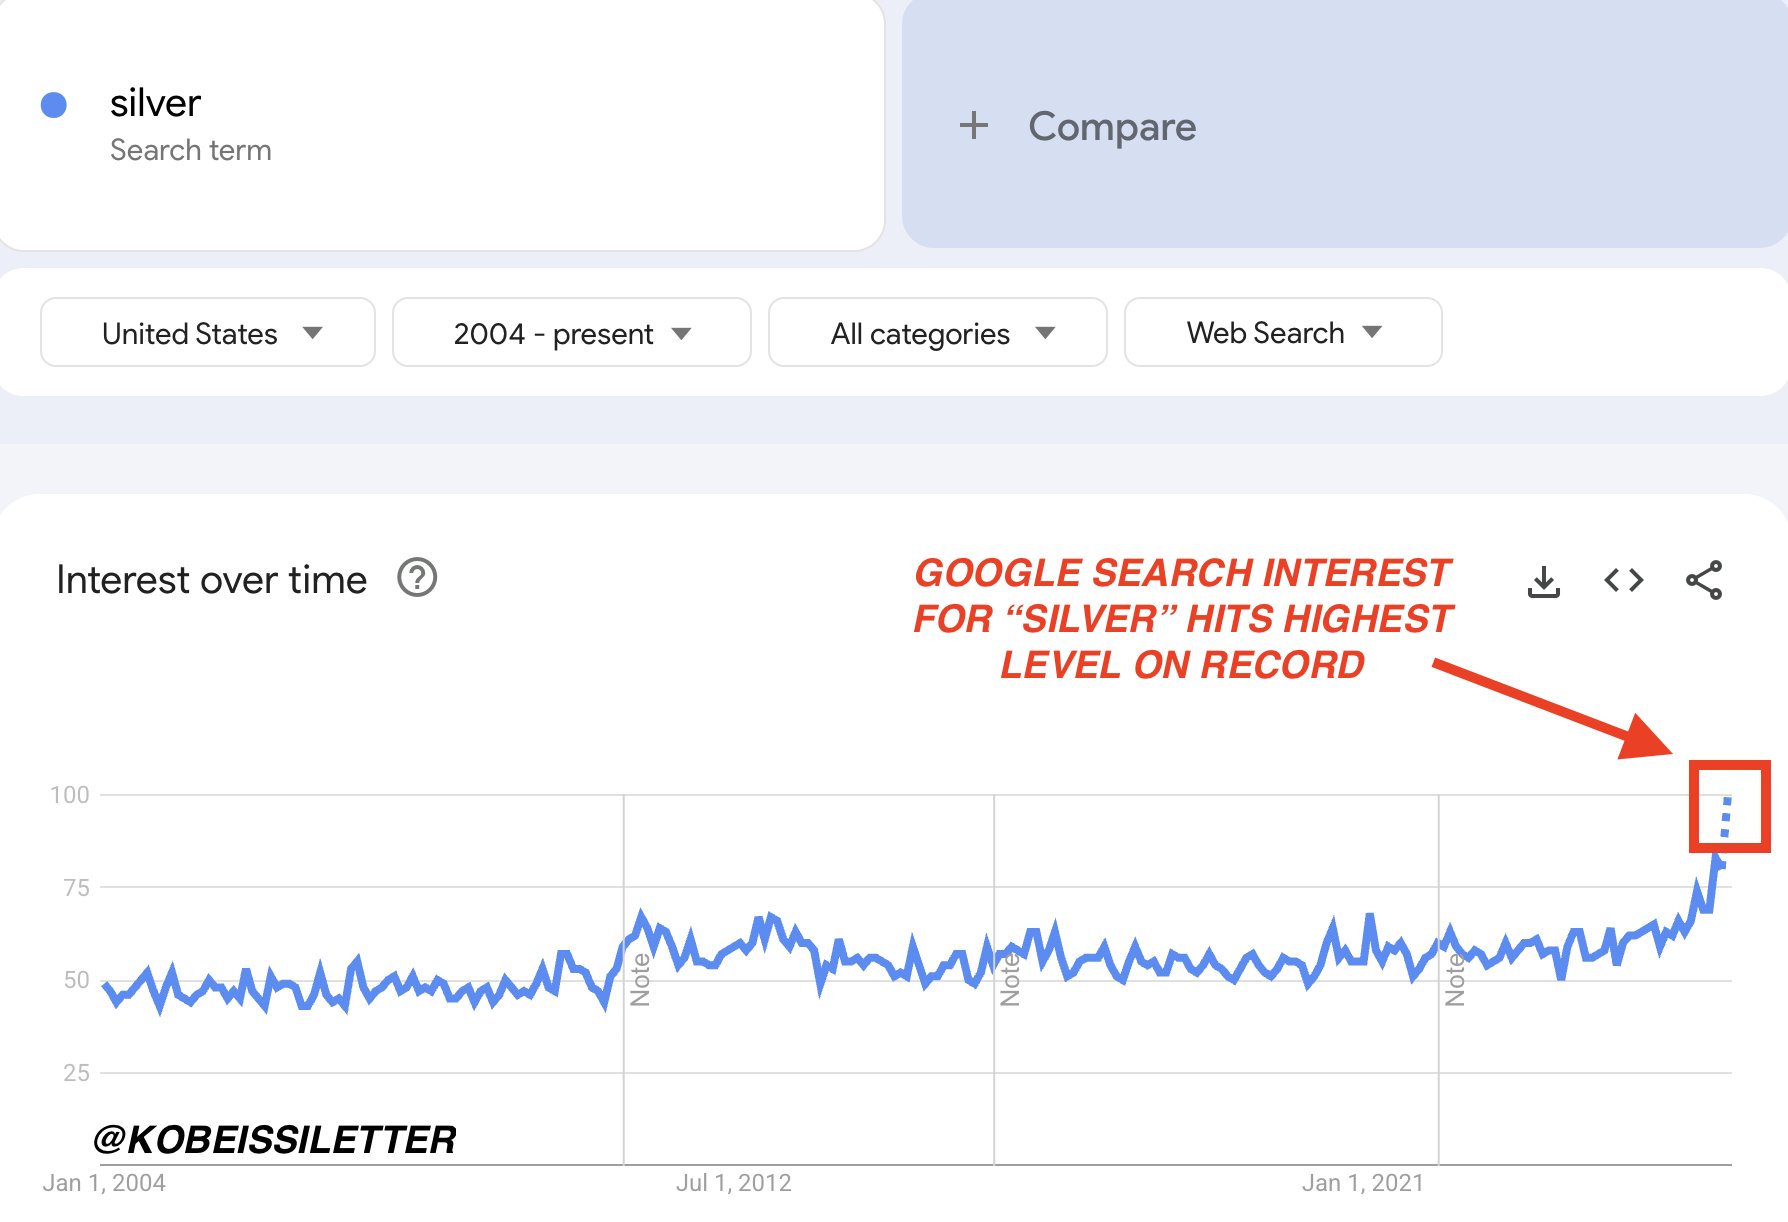
Google Trends shows search interest for "silver" hits an all-time high
Data: 45.98 BTC transferred from Hyperunit to Wintermute, valued at approximately $3.1894 million
Solana-based Meme Coin WhiteWhale Market Cap Surpasses $35 Million, 24-hour Growth 41.2%