XRP Price Targets $0.550 Breakout For A Potential Rally

XRP price started a recovery wave above the $0.5320 level. The price could gain pace if it clears the $0.5480 and $0.550 resistance levels.
- XRP price is aiming for a move above the $0.550 resistance zone.
- The price is now trading above $0.5320 and the 100-hourly Simple Moving Average.
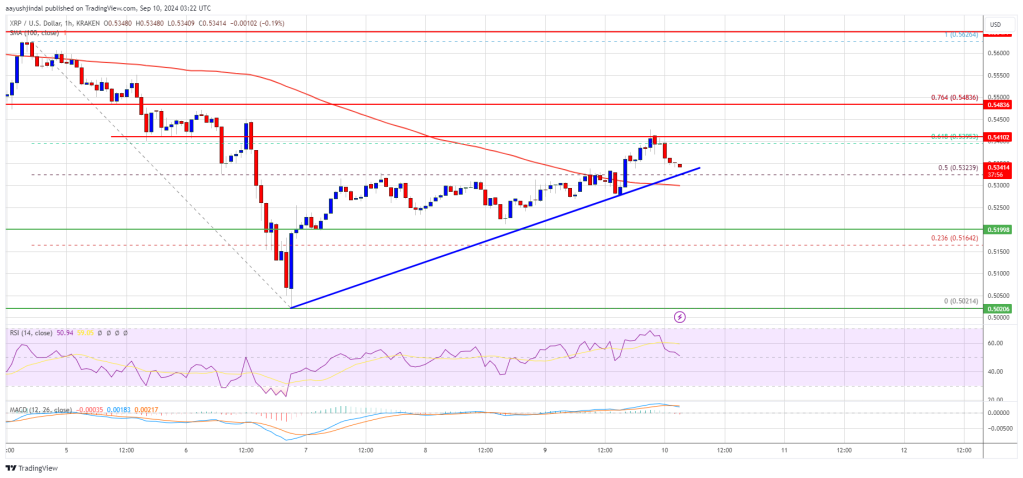
- There is a connecting bullish trend line forming with support at $0.5325 on the hourly chart of the XRP/USD pair (data source from Kraken).
- The pair could gain bullish momentum if it clears the $0.5480 and $0.550 resistance levels.
XRP Price Starts Recovery
XRP price formed a base near $0.5020 to start a recovery wave like Bitcoin and Ethereum . The price started a decent increase above the $0.5220 and $0.5250 resistance levels.
The bulls were able to push the price above the 50% Fib retracement level of the downward wave from the $0.5625 swing high to the $0.5020 swing low. The price even spiked above the $0.540 level before it faced resistance.
The price is now trading above $0.5320 and the 100-hourly Simple Moving Average. There is also a connecting bullish trend line forming with support at $0.5325 on the hourly chart of the XRP/USD pair.
On the upside, the price might face resistance near the $0.5420 level. The first major resistance is near the $0.5480 level or the 76.4% Fib retracement level of the downward wave from the $0.5625 swing high to the $0.5020 swing low. The next key resistance could be $0.5550.
A clear move above the $0.5550 resistance might send the price toward the $0.5680 resistance. The next major resistance is near the $0.5720 level. Any more gains might send the price toward the $0.5880 resistance or even $0.600 in the near term.
Another Decline?
If XRP fails to clear the $0.5420 resistance zone, it could start another decline. Initial support on the downside is near the $0.5320 level and the trend line. The next major support is $0.5220.
If there is a downside break and a close below the $0.5220 level, the price might continue to decline toward the $0.5080 support in the near term. The next major support sits at $0.5020.
Technical Indicators
Hourly MACD – The MACD for XRP/USD is now losing pace in the bullish zone.
Hourly RSI (Relative Strength Index) – The RSI for XRP/USD is now above the 50 level.
Major Support Levels – $0.5320 and $0.5220.
Major Resistance Levels – $0.5420 and $0.5500.
Disclaimer: The content of this article solely reflects the author's opinion and does not represent the platform in any capacity. This article is not intended to serve as a reference for making investment decisions.
You may also like
IOTA partners with top global institutions to build Africa’s “digital trade superhighway”: a new $70 billion market is about to explode
Africa is advancing trade digitalization through the ADAPT initiative, integrating payment, data, and identity systems with the goal of connecting all African countries by 2035. This aims to improve trade efficiency and unlock tens of billions of dollars in economic value. Summary generated by Mars AI. The accuracy and completeness of this summary are still being iteratively updated.

Panic selling is all wrong? Bernstein: The real bull market structure is more stable, stronger, and less likely to collapse
Bitcoin has recently experienced a significant 25% pullback. Bernstein believes this was caused by market panic over the four-year halving cycle. However, the fundamentals have changed: institutional funds such as spot ETF are absorbing the selling pressure, and the structure of long-term holdings is more stable. Summary generated by Mars AI. The accuracy and completeness of this content are still being iteratively improved.
Young Bitcoin holders panic sell 148K BTC as analysts call for sub-$90K BTC bottom

Rare Bitcoin futures signal could catch traders off-guard: Is a bottom forming?