
Bitcoin Price Holds Firm: Can It Power Toward New Gains?

Bitcoin price climbed further higher above the $67,500 resistance zone. BTC is now consolidating and might clear the $68,350 resistance to continue higher.
- Bitcoin remained stable and extended gains above the $68,000 zone.
- The price is trading above $67,200 and the 100 hourly Simple moving average.
- There is a connecting bullish trend line forming with support at $66,800 on the hourly chart of the BTC/USD pair (data feed from Kraken).
- The pair could rally further if there is a close above the $68,000 resistance zone.
Bitcoin Price Remains Supported for More Upsides
Bitcoin price remained supported and extended its increase above the $67,500 resistance . BTC cleared the $67,800 resistance to move into a positive zone. The price even rallied above the $68,000 and $68,200 resistance levels.
The price traded as high as $68,328 and currently consolidating gains. There was a minor decline below the $68,000 level. The price dipped and tested the 23.6% Fib retracement level of the upward move from the $64,686 swing low to the $68,328 high.
Bitcoin price is now trading above $67,200 and the 100 hourly Simple moving average . There is also a connecting bullish trend line forming with support at $66,800 on the hourly chart of the BTC/USD pair.
On the upside, the price could face resistance near the $68,000 level. The first key resistance is near the $68,350 level. A clear move above the $68,350 resistance might send the price higher. The next key resistance could be $68,800.
Source: BTCUSD on TradingView.comA close above the $68,800 resistance might initiate more gains. In the stated case, the price could rise and test the $70,0200 resistance level. Any more gains might send the price toward the $72,000 resistance level.
Another Drop In BTC?
If Bitcoin fails to rise above the $68,000 resistance zone, it could start another decline. Immediate support on the downside is near the $66,800 level and the trend line.
The first major support is near the $66,500 level and the 50% Fib retracement level of the upward move from the $64,686 swing low to the $68,328 high. The next support is now near the $66,500 zone. Any more losses might send the price toward the $65,400 support in the near term.
Technical indicators:
Hourly MACD – The MACD is now losing pace in the bullish zone.
Hourly RSI (Relative Strength Index) – The RSI for BTC/USD is now above the 50 level.
Major Support Levels – $66,800, followed by $65,400.
Major Resistance Levels – $68,000, and $68,350.
Disclaimer: The content of this article solely reflects the author's opinion and does not represent the platform in any capacity. This article is not intended to serve as a reference for making investment decisions.
You may also like
DTCC and JPMorgan just set the on-chain schedule, but the pilot relies on a controversial “undo” button
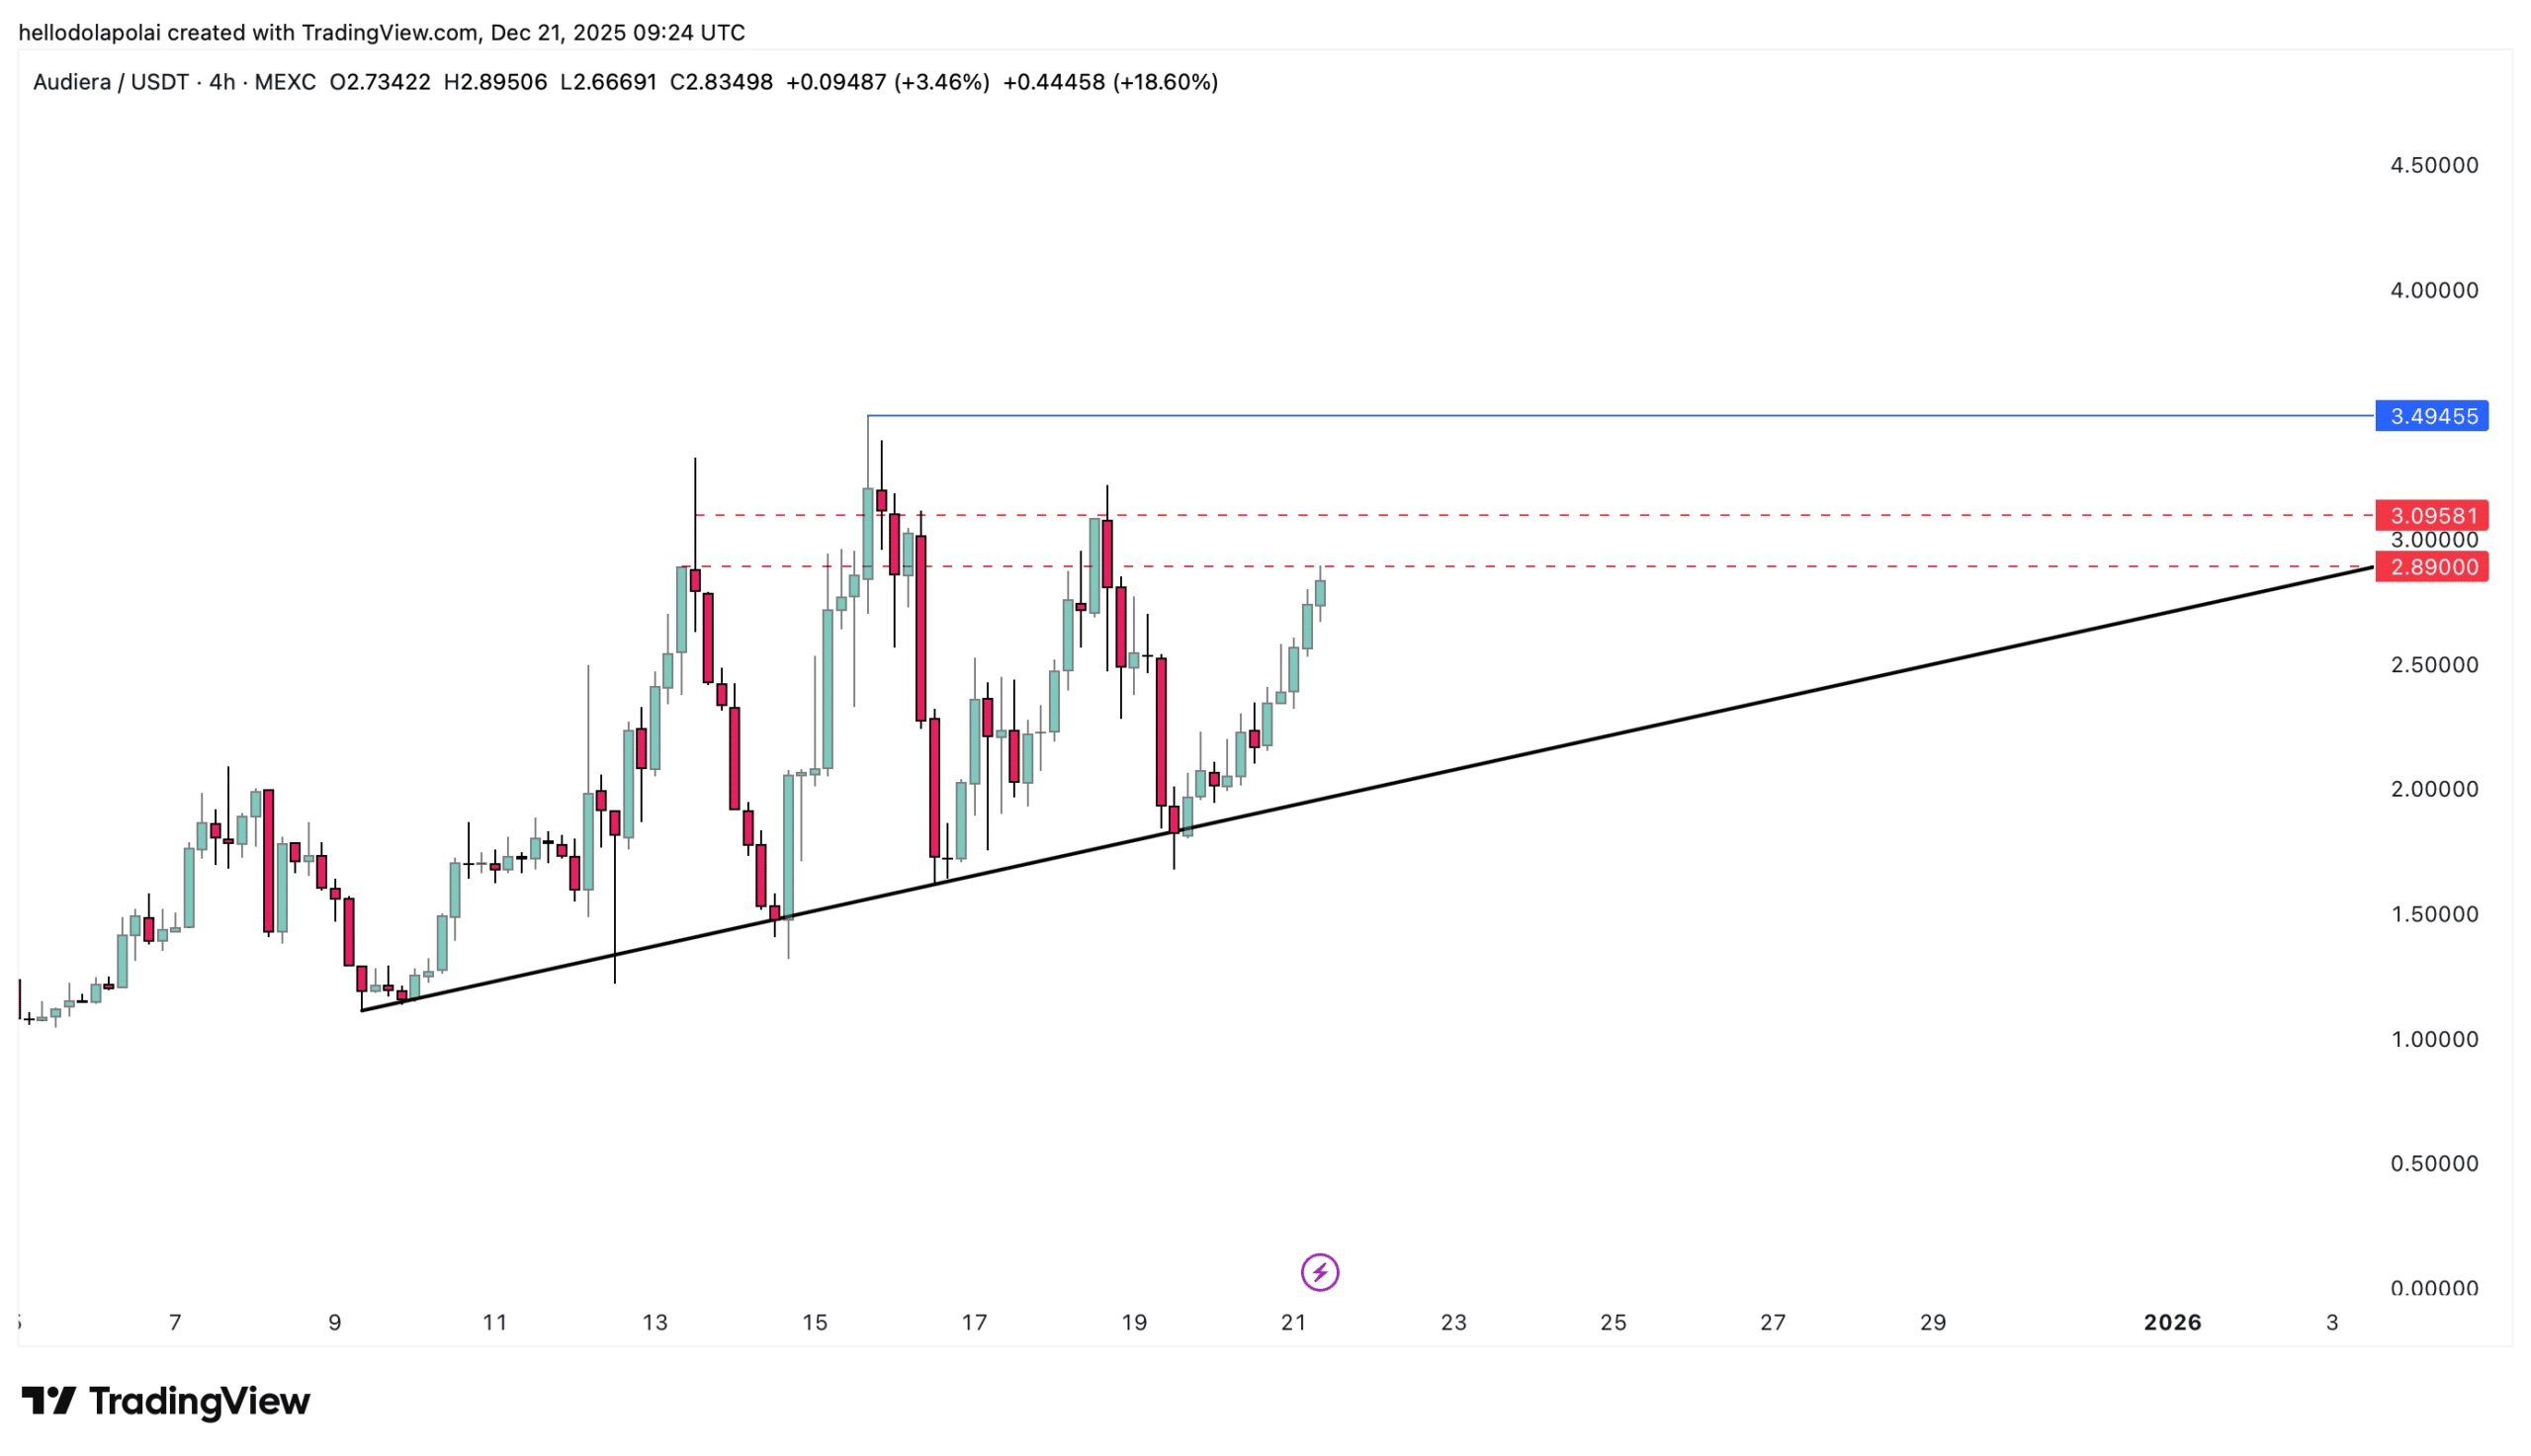
BEAT heats up, rallies 30%! A key level stands before Audiera’s ATH
Trending news
MoreDTCC and JPMorgan just set the on-chain schedule, but the pilot relies on a controversial “undo” button
Bitget Daily Digest (Dec.22)|The U.S. House of Representatives Is Considering a Tax Safe Harbor for Stablecoins and Crypto Staking; Large Token Unlocks for H, XPL, SOON, and Others This Week; BTC RSI Near a 3-Year Low