
Bittensor (TAO) Soars 20% Amid Growing Market Optimism

TAO’s recent price rally shows strong buying interest, but resistance and overbought indicators suggest a correction may precede further gains.
Bittensor (TAO) ‘s price has risen almost 20% in the last 24 hours, and technical indicators hint at potential trend shifts. The Ichimoku Cloud reveals a key resistance zone ahead, with TAO nearing the cloud but needing to break through it to confirm a sustained uptrend.
At the same time, the RSI has moved into overbought territory, suggesting that a short-term correction may be likely before further gains. Should TAO maintain its upward momentum and short-term EMAs cross above the long-term ones, a bullish reversal could occur, targeting higher resistance levels.
TAO Ichimoku Cloud Shows An Interesting Scenario
The Ichimoku Cloud chart for TAO shows the price recently moving upward toward the cloud, suggesting increased buying interest as it approaches this key level.
The cloud’s red color implies that selling pressure may still be present, creating a barrier that TAO, the biggest artificial intelligence coin in the market, will need to overcome if it is to continue rising.
Read more: Top 9 Artificial Intelligence (AI) Cryptocurrencies in 2024
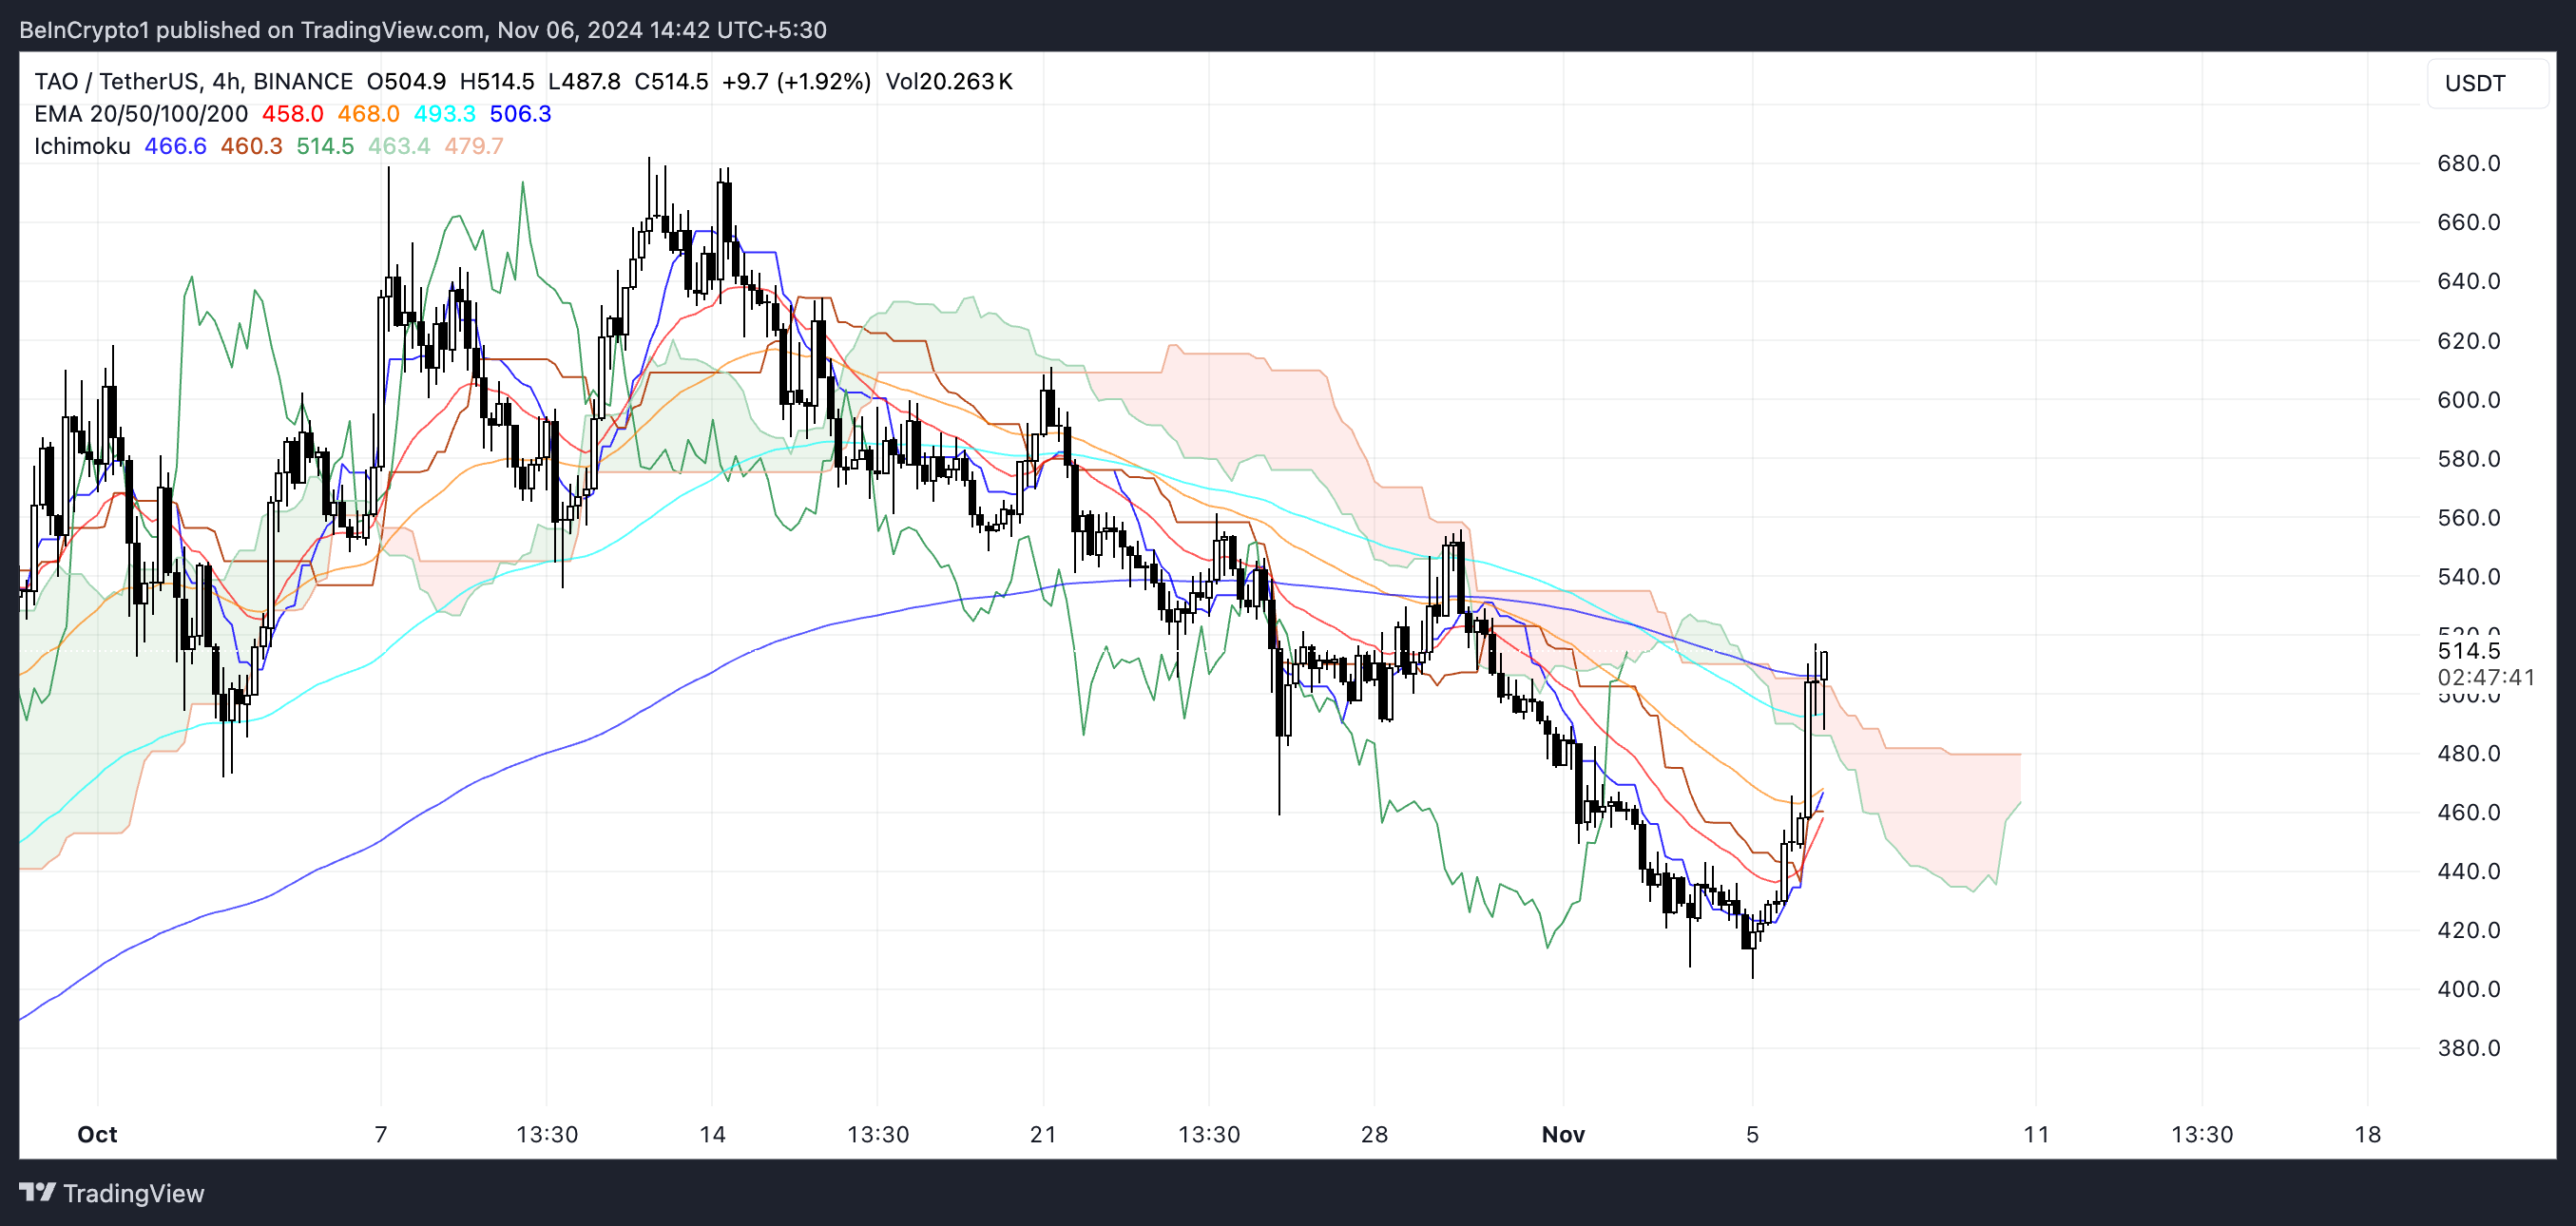 TAO Ichimoku Cloud. Source:
TradingView
TAO Ichimoku Cloud. Source:
TradingView
If TAO manages to keep above the cloud, it would indicate that it has overcome this resistance, potentially opening the way for further price increases.
However, if the price fails to break through the cloud, it could face renewed selling pressure that may push it back down.
Bittensor RSI Is Now Overbought
TAO’s RSI has sharply risen to 74.51, up from 30 just yesterday, indicating a rapid increase in buying momentum.
The RSI, or Relative Strength Index, measures the speed and change of price movements. Values above 70 signal overbought conditions, and values below 30 indicate oversold levels.
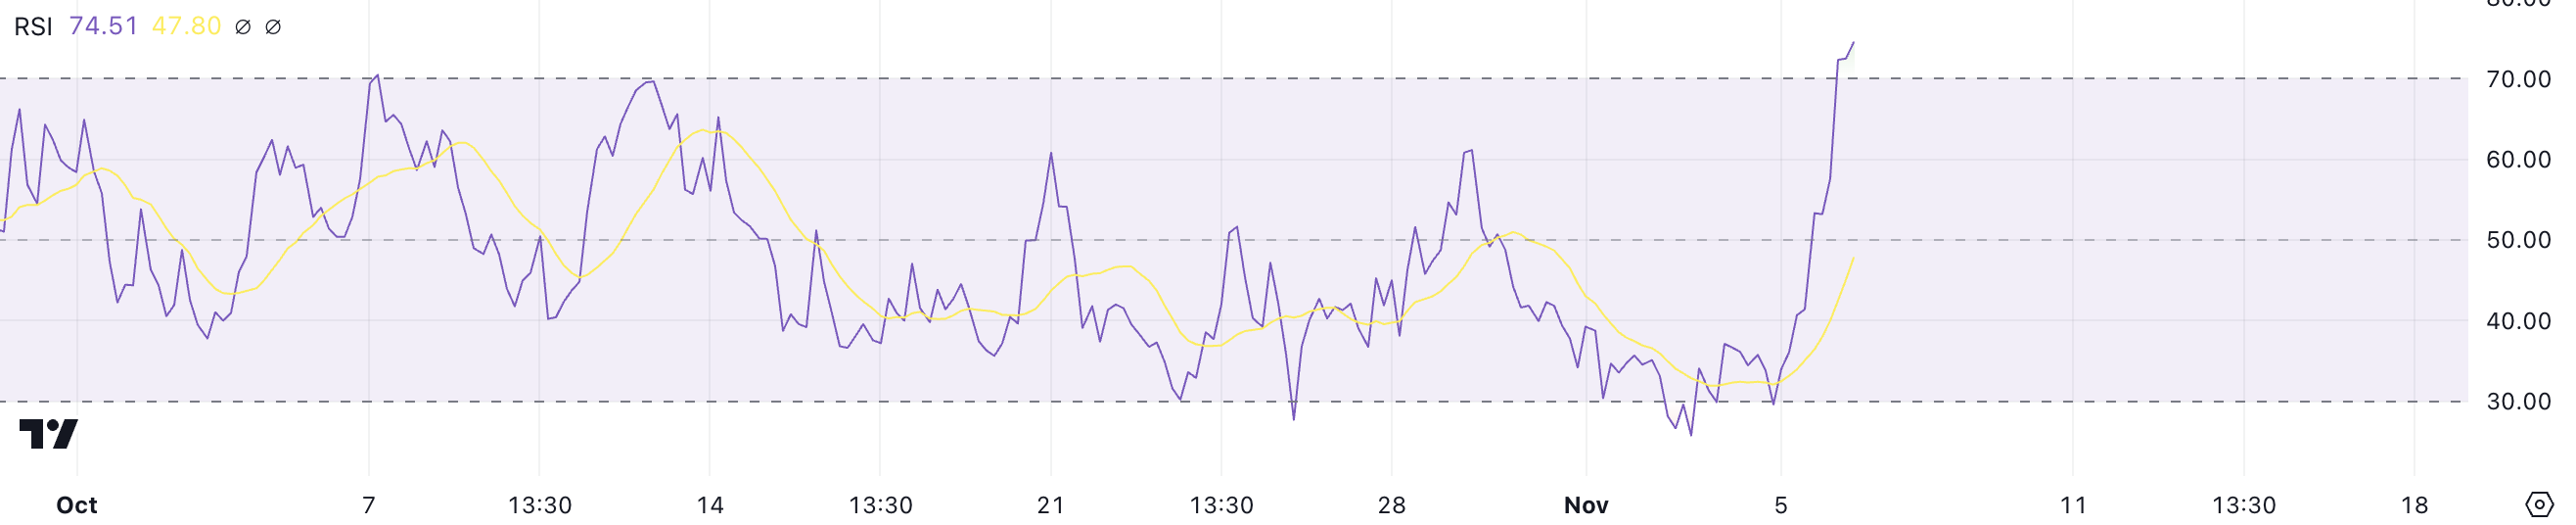 TAO RSI. Source:
TradingView
TAO RSI. Source:
TradingView
With TAO up nearly 20% in the last 24 hours, the elevated RSI level suggests that a potential price correction could be on the horizon.
When the RSI enters overbought territory, it often indicates that the asset may be due for a pullback as buying momentum reaches extreme levels.
TAO Price Prediction: A Correction Before A New Rebound?
TAO’s EMA lines currently show a bearish configuration, with the long-term EMAs positioned above the short-term ones, indicating a recent period of downward pressure.
However, the recent sharp increase in TAO price has caused the gap between these EMAs to narrow, suggesting that momentum may be shifting. This narrowing indicates that short-term buying strength is increasing, potentially setting the stage for a change in trend.
Read more: How To Invest in Artificial Intelligence (AI) Cryptocurrencies?
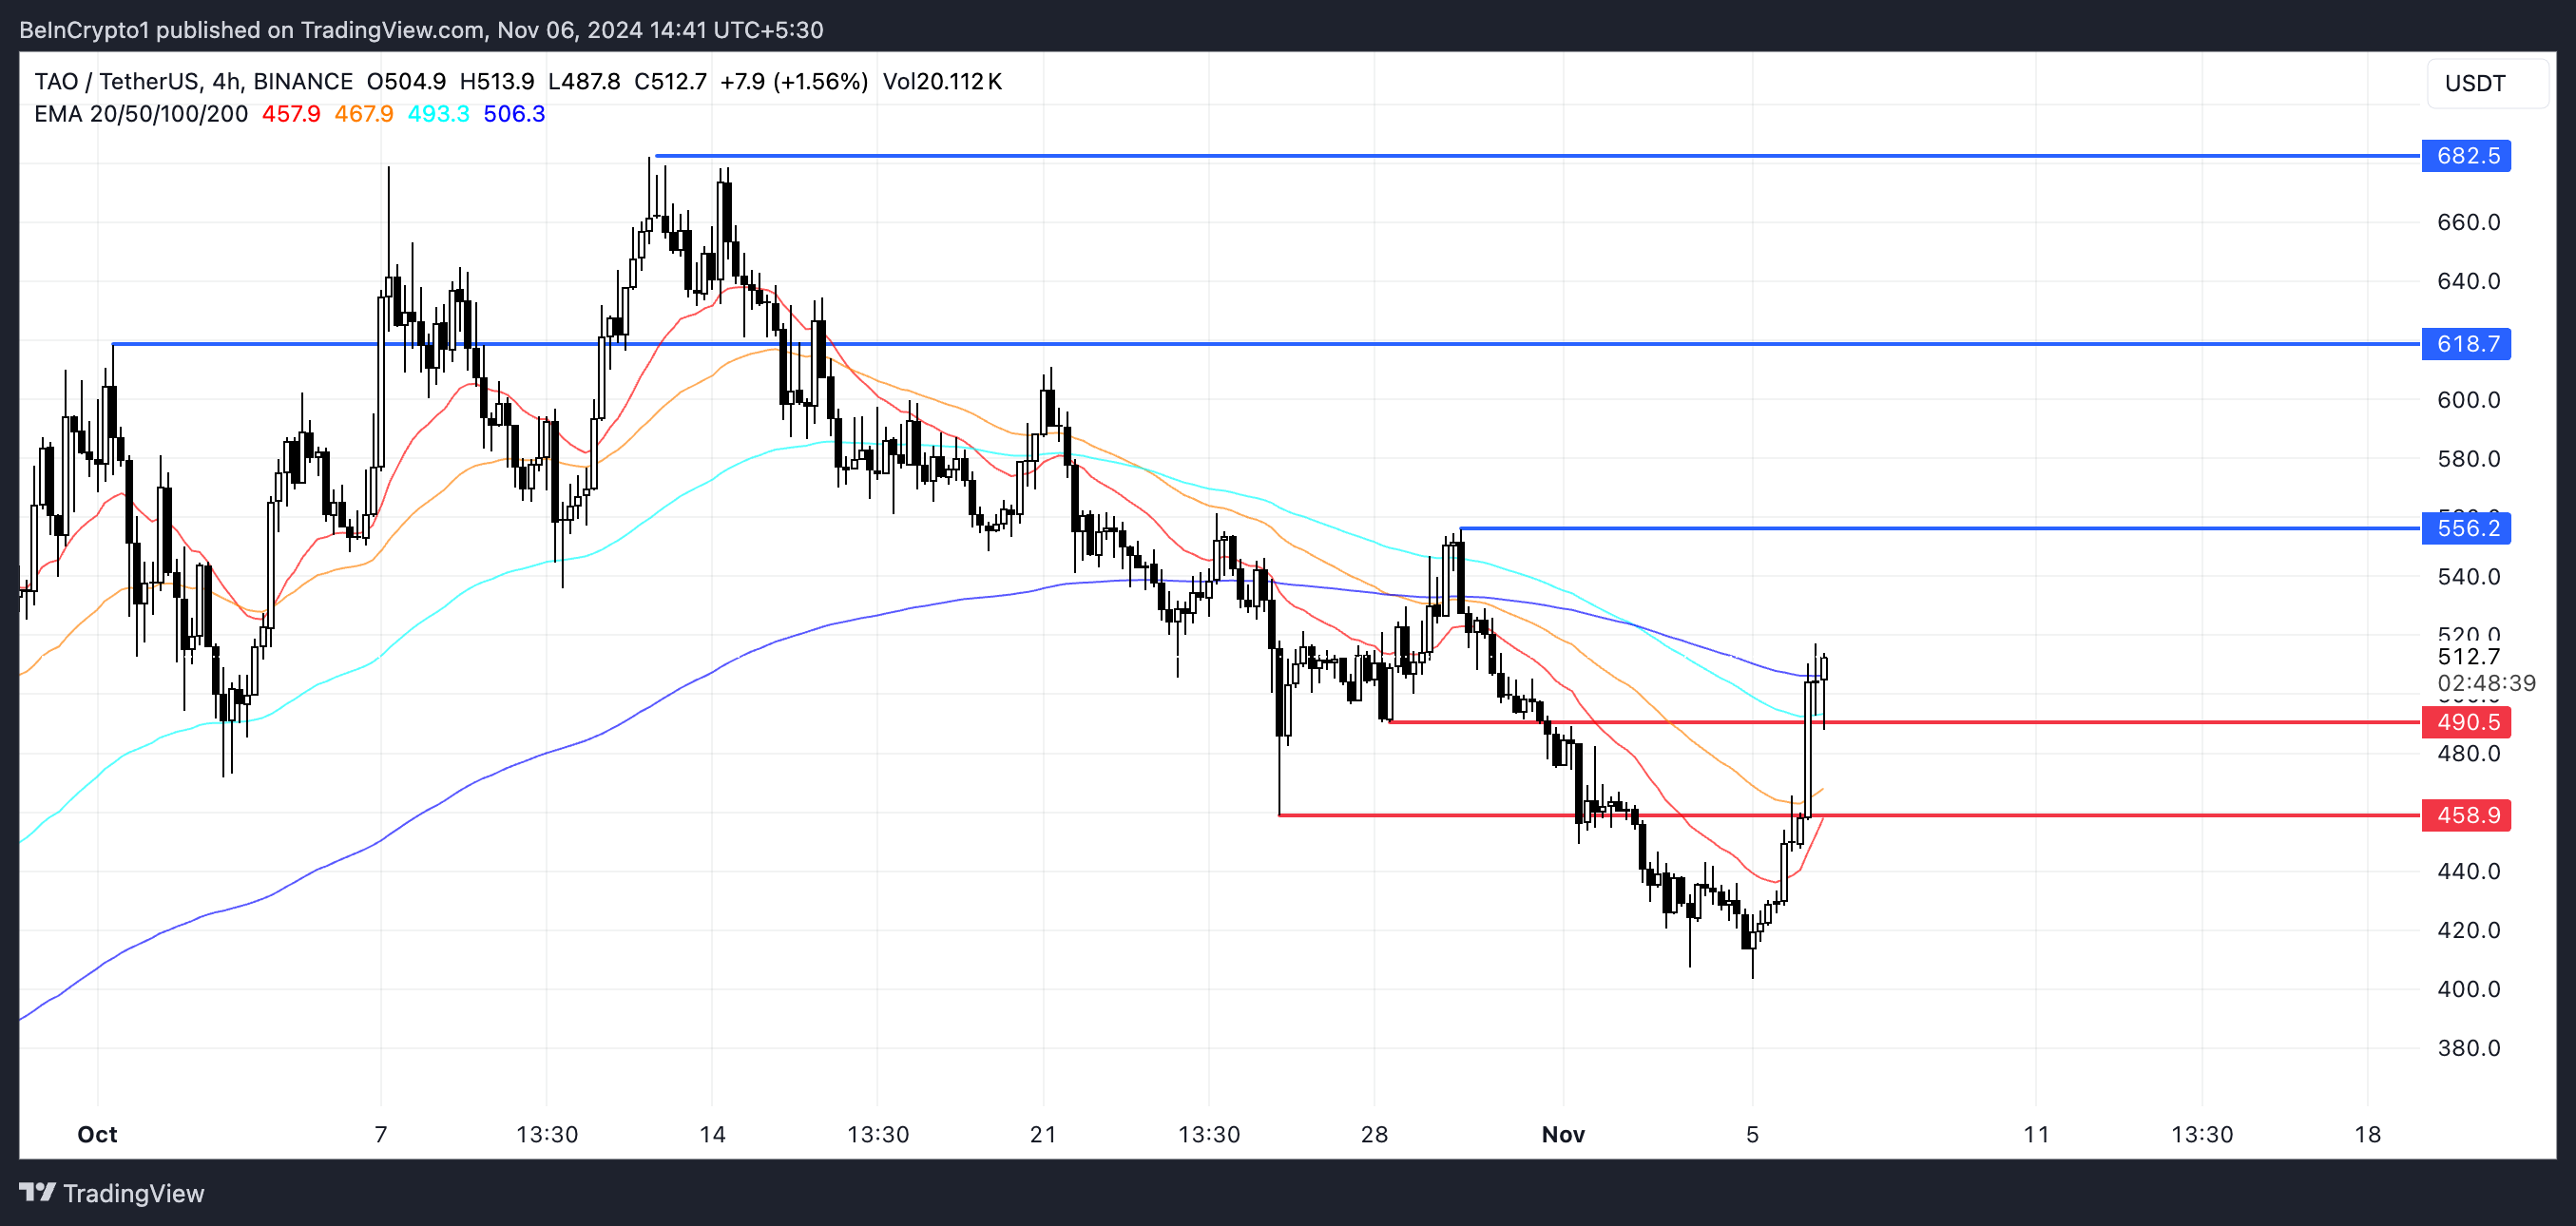 TAO EMA Lines and Support and Resistance. Source:
TradingView
TAO EMA Lines and Support and Resistance. Source:
TradingView
With the RSI at elevated levels, a price correction might occur before TAO attempts to move higher, which could lead it to test support zones around $490 and $458 in the short term. If this correction is brief and buying momentum resumes, and if the short-term EMAs continue climbing and eventually cross above the long-term ones, it could signal a bullish reversal.
In that scenario, TAO might aim for resistance levels at $556, $618, and even $682, which would present a possible 33% upside if the uptrend strengthens.
Disclaimer: The content of this article solely reflects the author's opinion and does not represent the platform in any capacity. This article is not intended to serve as a reference for making investment decisions.
You may also like
Bitget Spot Margin Announcement on Suspension of L3/USDT, ULTI/USDT Margin Trading Services
Bitget PoolX is listing Planck (PLANCK): Lock BTC to get PLANCK airdrop
Bitget x PLANCK Carnival: Grab a share of 1,880,000 PLANCK!
[Initial Listing] Bitget Will List Planck (PLANCK) in the Innovation, AI and DePIN Zone