
54% of Solana (SOL) Traders Anticipate Recovery After Dip Below $260

Solana’s recent bullish trend suggests potential gains, but could pressure bring the price below $200?
On November 23, Solana’s (SOL) price hit a new all-time high, sparking speculation that the altcoin could rally as high as $300. While that did not happen, recent data shows that Solana traders are betting on a rebound.
Why are traders confident? This on-chain analysis explores whether these positions could deliver gains or if many are at risk of liquidation.
Solana Longs Keep Shorts Out of the Way
Data from Coinglass reveals that Solana’s Long/Short ratio on the 1-hour timeframe has climbed to 1.17. This ratio gauges market expectations, indicating whether most traders hold bearish or bullish positions.
When the ratio falls below 1, it indicates more shorts (sellers) than longs (buyers). Conversely, a ratio above 1 suggests a higher number of traders betting on a price increase compared to those anticipating a decline.
Currently, 54% of Solana traders hold long positions, while 46.17% expect a drop below $255. This indicates a bullish leaning among traders, with more optimism about the token’s price rising than falling.
 Solana Long/Short Ratio. Source:
Coinglass
Solana Long/Short Ratio. Source:
Coinglass
Additionally, it appears that these traders’ positions could prove profitable, thanks to an uptick in Solana’s Transaction Rate, which is the number of successful transactions processed per second on its blockchain.
An increasing Transaction Rate signals heightened user activity and engagement with the cryptocurrency, while a decline indicates reduced interest. According to Glassnode, Solana’s Transaction Rate has been climbing. If this trend continues, it could propel SOL’s price past its all-time high.
 Solana Transaction Rate. Source:
Glassnode
Solana Transaction Rate. Source:
Glassnode
SOL Price Prediction: Upside Potential Remains
On the weekly chart, Solana’s price has surged above the 20 and 50 Exponential Moving Averages (EMAs), key indicators that measure trends. When the price sits above the EMAs, it signals a bullish trend, while a drop below them typically signals bearish momentum.
With SOL currently priced at $255, above both EMAs, the altcoin seems poised to continue its upward direction. The formation of a bull flag further supports this bullish outlook.
A bull flag is a continuation pattern, indicating that once the price breaks out, it’s likely to maintain the prior upward momentum. As seen below, SOL has already broken out of the consolidation pattern and is heading higher.
 Solana Weekly Analysis. Source:
TradingView
Solana Weekly Analysis. Source:
TradingView
As long as the price remains above the upper trendline of the consolidation phase, it could rise toward $325. However, if selling pressure takes hold, this bullish scenario could shift. In that case, SOL might fall below $200.
Disclaimer: The content of this article solely reflects the author's opinion and does not represent the platform in any capacity. This article is not intended to serve as a reference for making investment decisions.
You may also like
A decade-long tug-of-war ends: "Crypto Market Structure Bill" sprints to the Senate
At the Blockchain Association Policy Summit, U.S. Senators Gillibrand and Lummis stated that the "Crypto Market Structure Bill" is expected to have its draft released by the end of this week, with revisions and hearings scheduled for next week. The bill aims to establish clear boundaries for digital assets by adopting a classification-based regulatory framework, clearly distinguishing between digital commodities and digital securities, and providing a pathway for exemptions for mature blockchains to ensure that regulation does not stifle technological progress. The bill also requires digital commodity trading platforms to register with the CFTC and establishes a joint advisory committee to prevent regulatory gaps or overlapping oversight. Summary generated by Mars AI. The accuracy and completeness of this summary, generated by the Mars AI model, is still being iteratively updated.

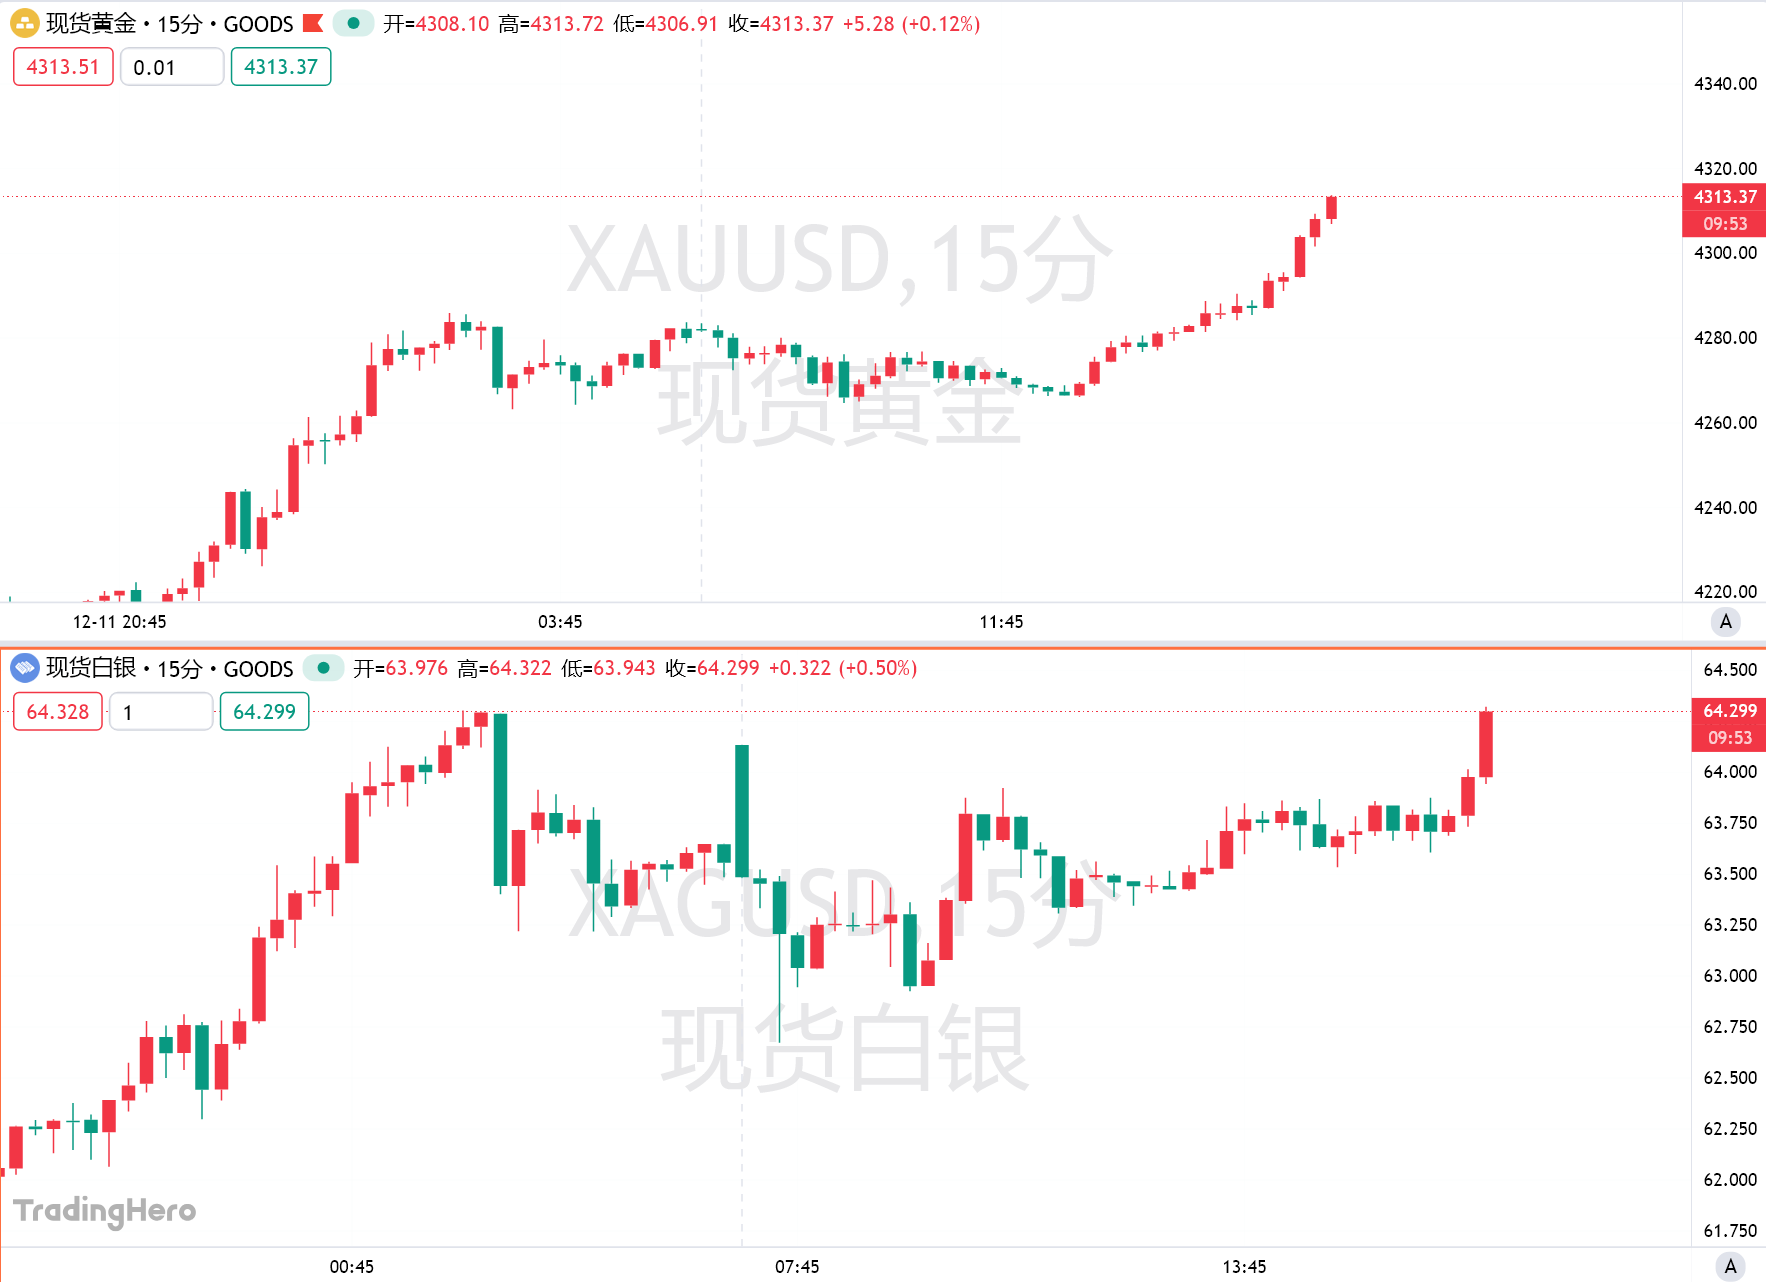
Gold surpasses the $4,310 mark—Is the "bull frenzy" returning?
Boosted by expectations of further easing from the Federal Reserve, gold has risen for four consecutive days. Technical indicators show strong bullish signals, but there remains one more hurdle before reaching a new all-time high.
Trend Research: Why Are We Still Bullish on ETH?
Against the backdrop of relatively accommodative expectations in both China and the US, which suppress asset downside volatility, and with extreme fear and capital sentiment not yet fully recovered, ETH remains in a favorable "buy zone."
