
Cardano (ADA) Uptrend Faces Hurdles: Will Bulls Break the Barrier?

Cardano price started a downside correction from the $1.1780 zone. ADA is consolidating and facing hurdles near the $1.180 and $1.200 levels.
- ADA price started a decent increase from the $0.910 support zone.
- The price is trading above $1.050 and the 100-hourly simple moving average.
- There is a major bearish trend line forming with resistance at $1.160 on the hourly chart of the ADA/USD pair (data source from Kraken).
- The pair could start another increase if it clears the $1.180 resistance zone.
Cardano Price Eyes Upside Break
After forming a base above the $1.00 level, Cardano started a fresh increase like Bitcoin and Ethereum . ADA was able to climb above the $1.050 and $1.120 resistance levels.
However, the bears were active below the $1.20 level. A high was formed at $1.1781 and the price is now consolidating gains. There was a minor decline below the $1.120 level. The price dipped below the 23.6% Fib retracement level of the upward move from the $0.910 swing low to the $1.1781 high.
Cardano price is now trading above $1.050 and the 100-hourly simple moving average. On the upside, the price might face resistance near the $1.150 zone. There is also a major bearish trend line forming with resistance at $1.160 on the hourly chart of the ADA/USD pair.
Source: ADAUSD on TradingView.comThe first resistance is near $1.180. The next key resistance might be $1.20. If there is a close above the $1.2 resistance, the price could start a strong rally. In the stated case, the price could rise toward the $1.2280 region. Any more gains might call for a move toward $1.250.
Another Decline in ADA?
If Cardano’s price fails to climb above the $1.180 resistance level, it could start another decline. Immediate support on the downside is near the $1.10750 level.
The next major support is near the $1.050 level or the 50% Fib retracement level of the upward move from the $0.910 swing low to the $1.1781 high. A downside break below the $1.050 level could open the doors for a test of $1.00. The next major support is near the $0.920 level where the bulls might emerge.
Technical Indicators
Hourly MACD – The MACD for ADA/USD is gaining momentum in the bearish zone.
Hourly RSI (Relative Strength Index) – The RSI for ADA/USD is now below the 50 level.
Major Support Levels – $1.070 and $1.050.
Major Resistance Levels – $1.160 and $1.180.
Disclaimer: The content of this article solely reflects the author's opinion and does not represent the platform in any capacity. This article is not intended to serve as a reference for making investment decisions.
You may also like
Has the four-year cycle of Bitcoin failed?
The various anomalies in this cycle—including waning sentiment, weakening returns, disrupted rhythms, and institutional dominance—have indeed led the market to intuitively feel that the familiar four-year cycle is no longer effective.
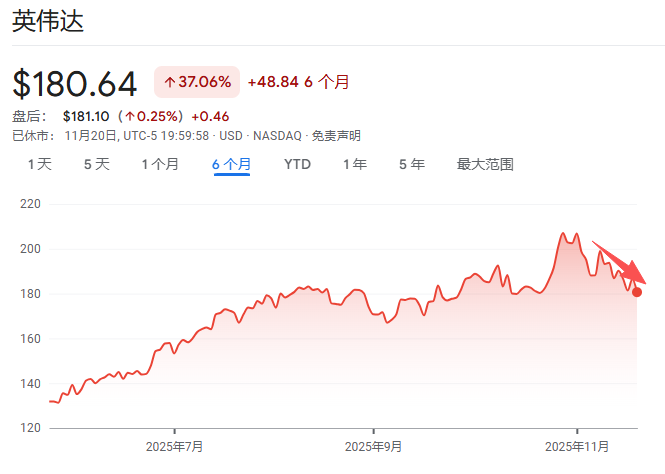
At an internal Nvidia meeting, Jensen Huang admitted: It's too difficult. "If we do well, it's an AI bubble," and "if we fall even slightly short of expectations, the whole world will collapse."
Jensen Huang has rarely admitted that Nvidia is now facing an unsolvable dilemma: if its performance is outstanding, it will be accused of fueling the AI bubble; if its performance disappoints, it will be seen as evidence that the bubble has burst.
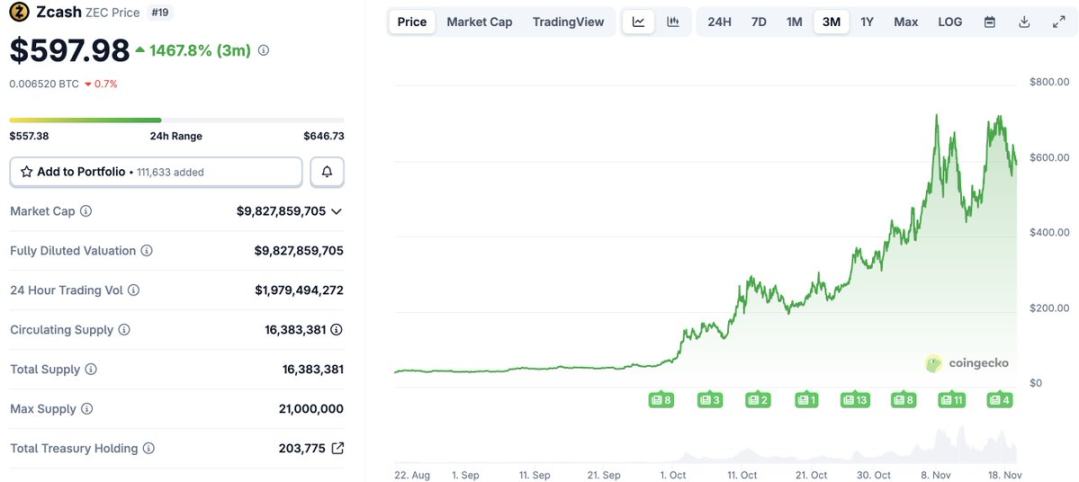
After a 1460% Surge: Reassessing the Value Foundation of ZEC
Narratives and sentiment can create myths, but fundamentals determine how far those myths can go.
The demise of a DAT company
The $1 billion Ethereum DAT plan led by Li Lin and others has been shelved due to the bear market, and funds have been returned. This "going with the flow" approach may reflect consideration of investor sentiment.