
SHIB’s Downward Pressure Grows: A Breakdown Below Support


- SHIB is testing key support at 0.00001079 USD with a high potential of a breakdown.
- Fibonacci levels indicate potential further downside for SHIB if support fails.
- MACD and RSI indicators suggest bearish momentum is in control of Shiba Inu’s price.
Shiba Inu has shown signs of weakness on the 7-day chart, indicating the possibility of a price dip in the upcoming weeks. Currently priced at 0.00001489 USD, SHIB is trading within a narrowing channel, which suggests a high chance of a breakdown. The token now tests a supportive zone at the 0.00001079 USD mark, a price it has held fast within the last months. Should this level be breached, SHIB could come under further pressure to the downside, making the bearish outlook in the market permanent.
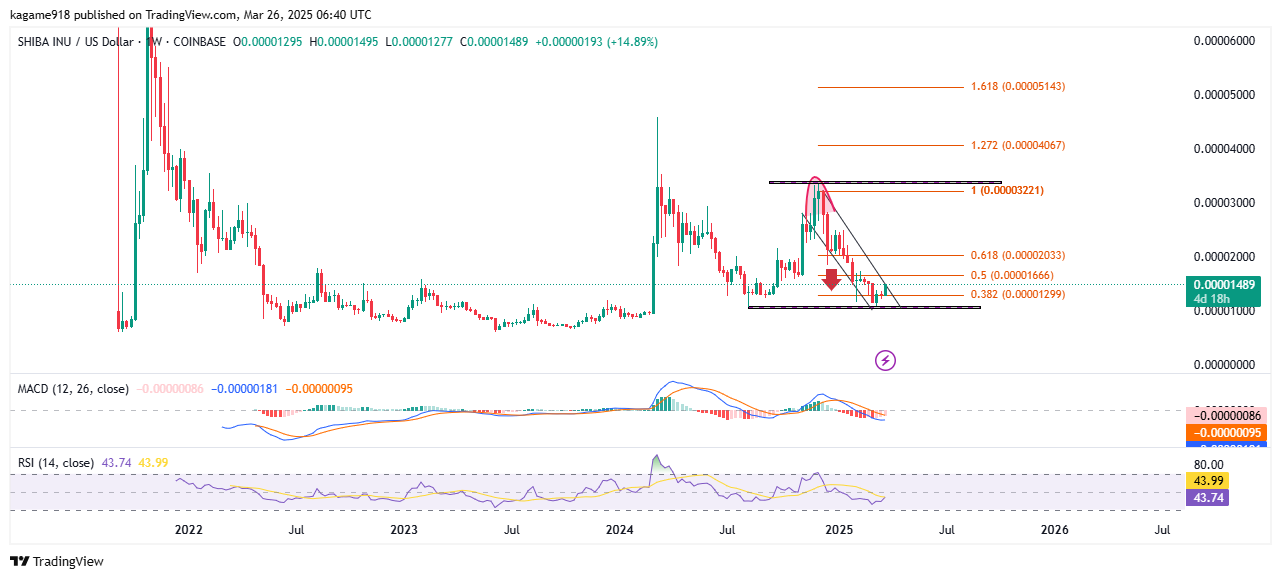
Source: Tradingview
Support and Resistance Levels in Focus
The current support level for SHIB is 0.00001079 USD, often referred to as a key level for traders that has seen consistent testing through recent price action. However, with price action narrowing on the chart, SHIB may see a break beneath this support, with further decline of the token’s value.
On the resistance side, SHIB has been encountering strong resistance at 0.00003221 USD, marked by the Fibonacci retracement level of 1.0. This is a critical zone for SHIB, as any further rally will likely face resistance at this point. The token has made several attempts to break past this resistance but has failed to sustain upward momentum. This price range will be watched closely by market participants, as a breakout above 0.00003221 USD could signal a reversal in the current trend.
Related: Shiba Inu’s Technical Levels Show Room for a Bullish Move
Fibonacci Analysis: Potential for Further Downside
A further survey of SHIB’s price through Fibonacci retracement levels has revealed that the token has currently settled down at the 0.382 level located at 0.00001299 USD. This is a high level at which the breach below could indicate further downside. The Fibonacci tool also delineates a concern of a number of points above the price of 0.5 retracements of 0.00001666 USD and 0.618 in 0.00002033 USD, and may offer possible resistance should SHIB manage to retrace its steps.
However, the present price action with directions in the triangle formation should indicate SHIB in the future facing a collapse. The MACD indicator further assures this possibility, as it remains in bearish territory with a negative histogram, suggesting that selling momentum is still in play. The RSI, hovering around 43.74, is also signaling neutral conditions, but its inability to break into the overbought territory could indicate a lack of strong buying pressure.
The post SHIB’s Downward Pressure Grows: A Breakdown Below Support appeared first on Cryptotale.
Disclaimer: The content of this article solely reflects the author's opinion and does not represent the platform in any capacity. This article is not intended to serve as a reference for making investment decisions.
You may also like
Aster News Today: Aster Sets New Standard for DEXs by Introducing CEX-Level Liquidity Hybrid
- Aster launches Stage 4 "Harvest" airdrop and $10M "Double Harvest" trading competition to boost ecosystem growth. - Dual-reward system allows users to earn airdrop and competition tokens simultaneously through trading activity. - Platform develops on-chain order-book protocol for CEX-like speeds and expands gold/index perpetual contracts. - Global expansion includes Binance events and wallet integrations, while token utility expands to staking and governance. - Hybrid model combines decentralized infrast
The Federal Reserve's Change in Policy and Its Unexpected Effect on Solana's Price Rally
- The Fed's 2025 shift to easing policy, ending QT and cutting rates, injected liquidity, boosting Solana and other cryptos as risk assets. - Historical parallels show Fed liquidity expansions correlate with crypto rallies, though Solana's December 2025 price data remains unclear. - Cryptocurrencies now exhibit macroeconomic sensitivity, with Fed easing potentially increasing demand for high-volatility assets like Solana. - Investors must balance Fed-driven liquidity benefits against crypto's volatility an

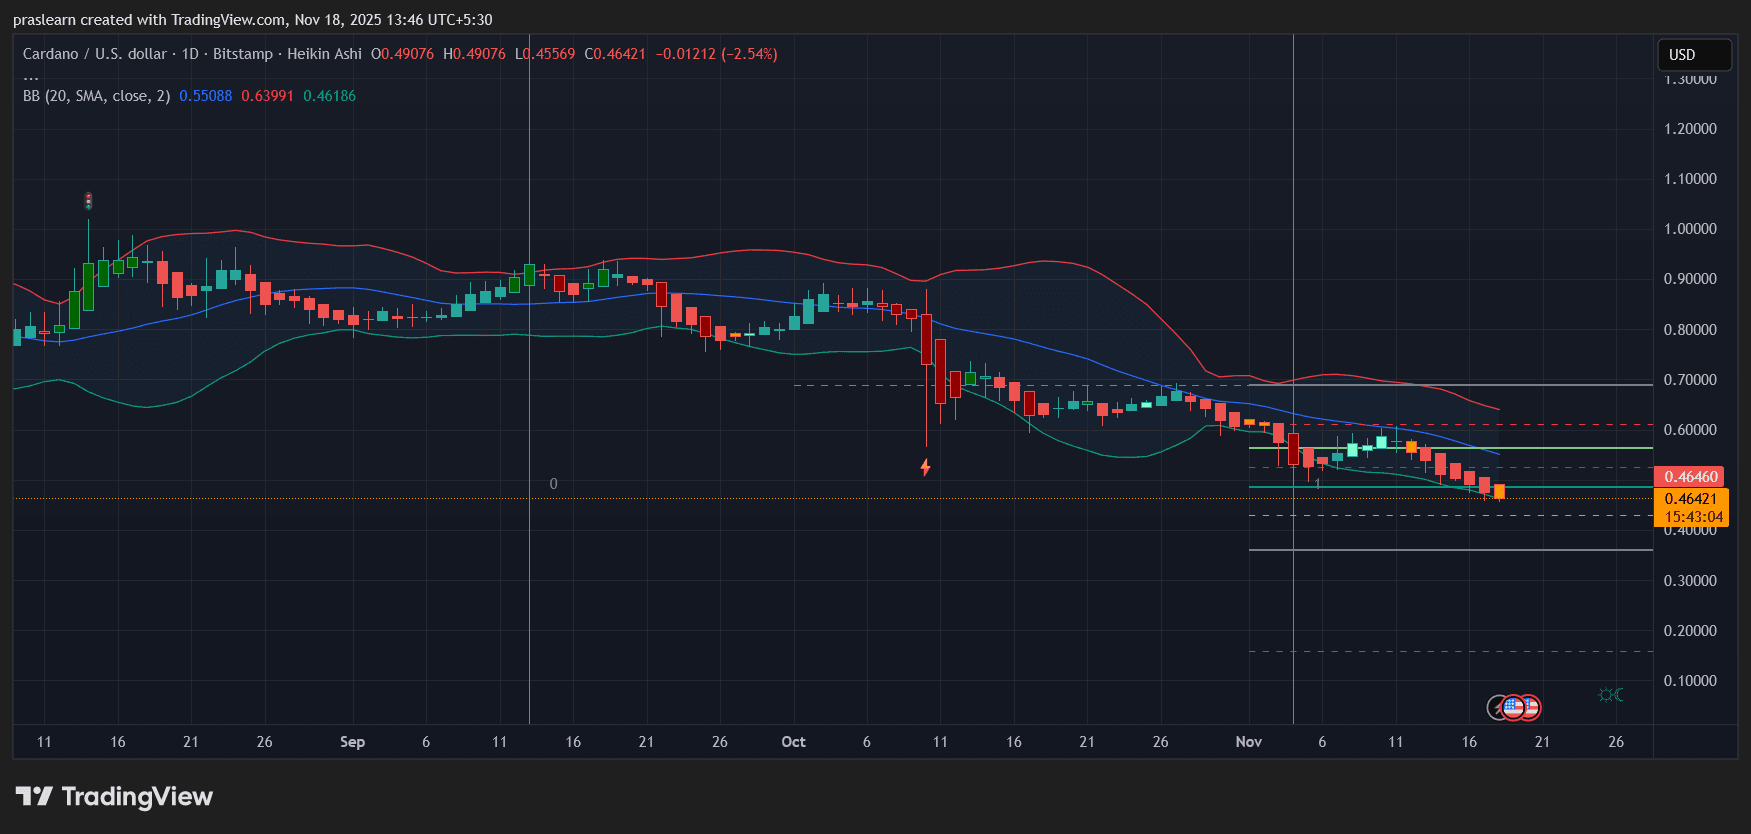
Cardano Price Crashes: Is $0.40 Next?
Bitcoin Updates: Investor’s $33M ETH Wager Withstands $1.1B Liquidation Surge While Crypto Markets Approach Bearish Levels
- A top crypto trader liquidated $7. 3M before re-entering with a $33M ETH long amid $1.1B market-wide liquidations on Nov 14, 2025. - Long positions suffered 973M losses vs 131M short liquidations, with a $44.29M BTC-USDT position marking extreme leverage use. - Bitcoin's RSI hit "massively oversold" levels and fell below its 3-year volatility band, echoing 2022 FTX-era market stress. - The crisis reignited debates over leveraged trading risks, with 246,000 traders forced to exit positions during the shar