Bitget App
Trade smarter
Buy cryptoMarketsTradeFuturesEarnWeb3SquareMore
Trade
Spot
Buy and sell crypto with ease
Margin
Amplify your capital and maximize fund efficiency
Onchain
Going Onchain, without going Onchain!
Convert
Zero fees, no slippage
Explore
Launchhub
Gain the edge early and start winning
Copy
Copy elite trader with one click
Bots
Simple, fast, and reliable AI trading bot
Trade
USDT-M Futures
Futures settled in USDT
USDC-M Futures
Futures settled in USDC
Coin-M Futures
Futures settled in cryptocurrencies
Explore
Futures guide
A beginner-to-advanced journey in futures trading
Futures promotions
Generous rewards await
Overview
A variety of products to grow your assets
Simple Earn
Deposit and withdraw anytime to earn flexible returns with zero risk
On-chain Earn
Earn profits daily without risking principal
Structured Earn
Robust financial innovation to navigate market swings
VIP and Wealth Management
Premium services for smart wealth management
Loans
Flexible borrowing with high fund security
Sandbox (SAND) Retesting Its Falling Wedge Breakout: Could a Reversal Be Near?

Sandbox (SAND) Retesting Its Falling Wedge Breakout: Could a Reversal Be Near?

CoinsProbeCoinsProbe2025/03/28 23:55
By:Nilesh Hembade

Date: Fri, March 28, 2025 | 03:56 PM GMT

The cryptocurrency market is witnessing renewed bearish pressure, wiping out the recovery gains from earlier this week. Ethereum (ETH) has dropped over 6% in the last 24 hours, dipping below the $1,900 mark, which has intensified selling across major altcoins .

Amid this downturn, Sandbox (SAND) has also faced a sharp decline, dropping over 8% today, and extending its 90-day correction cycle to nearly three months of continuous losses. However, despite the recent bearish price action, a strong technical pattern is emerging, hinting at a possible trend reversal in the near future.

Sandbox (SAND) Retesting Its Falling Wedge Breakout: Could a Reversal Be Near? image 0 Source: Coinmarketcap

Retesting Its Falling Wedge Breakout

A key development in SAND’s price structure is its retest of a falling wedge breakout, a bullish reversal pattern that has been forming for nearly two years. The falling wedge is characterized by descending resistance and support lines, which have been gradually compressing the price into a tighter range. Historically, this pattern often signals the end of a prolonged downtrend and a potential shift in momentum.
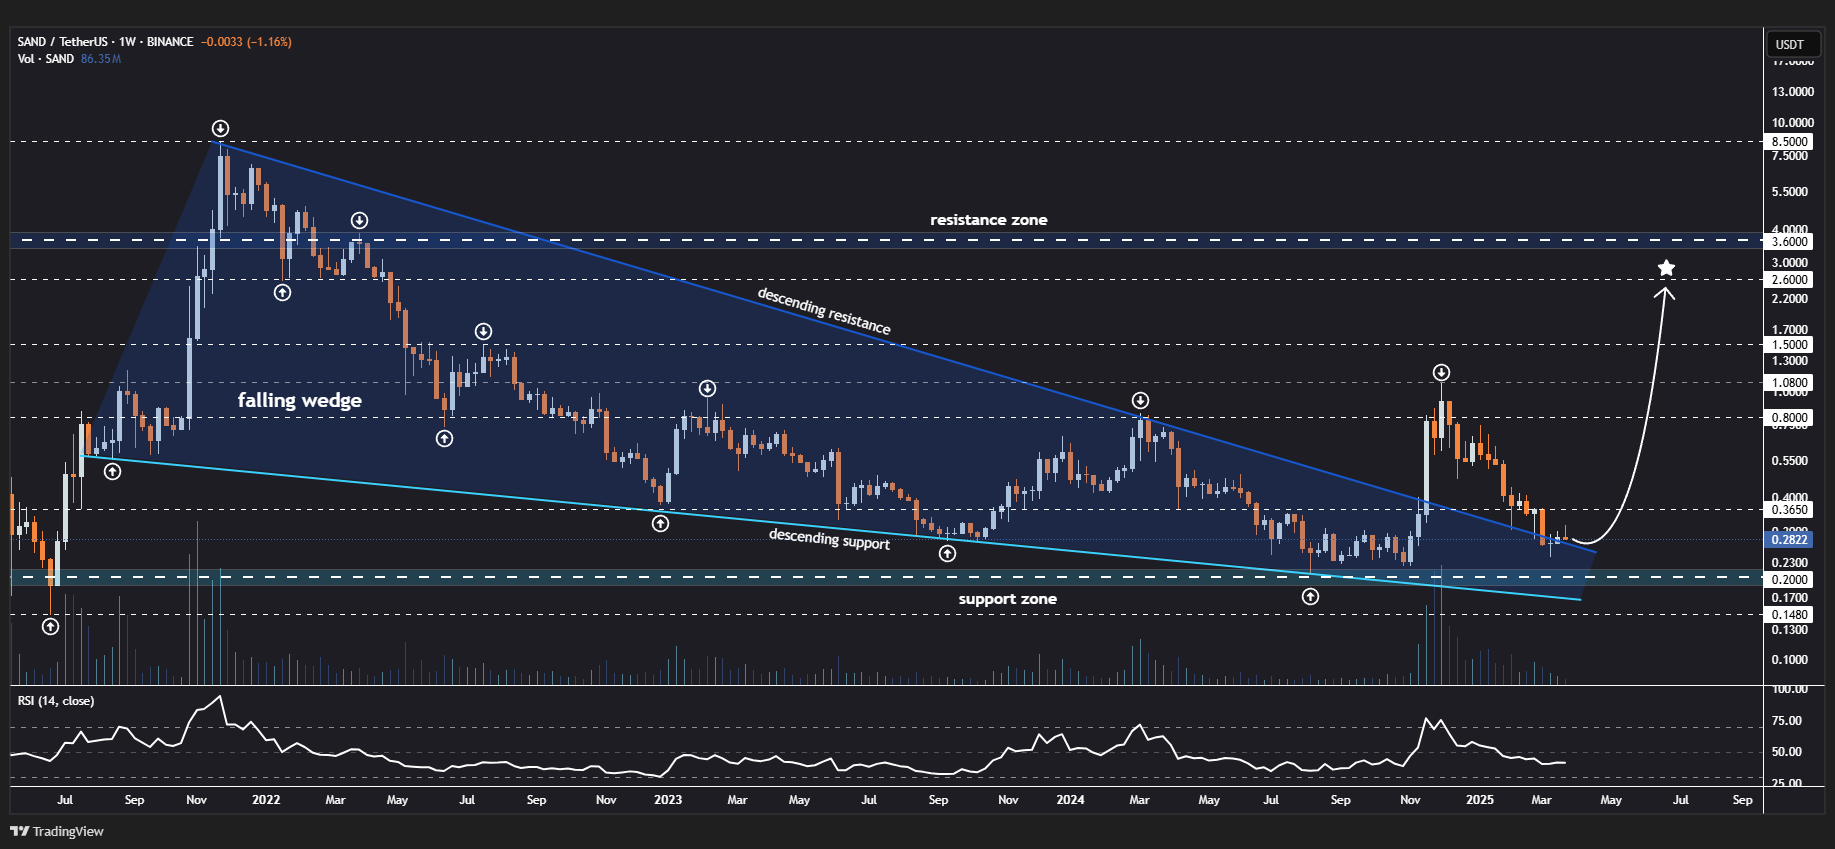
Sandbox (SAND) Retesting Its Falling Wedge Breakout: Could a Reversal Be Near? image 1 Sandbox (SAND) Weekly Chart/Source: @JohncyCrypto (X)

The weekly chart shows that SAND has been trading within this falling wedge since its all-time high, with multiple rejection points from the descending resistance. The breakout from this structure, followed by a retest, is a crucial technical signal that could pave the way for a strong bullish reversal.

Currently, SAND is trading near the support zone between $0.23 and $0.28, an area that has historically acted as a strong demand region. If buyers successfully defend this level, the price could start a significant uptrend, with key targets at $0.365, $0.800, $1.080, $1.500, and $2.600.

Could a Reversal Be Near?

The coming days will be crucial in determining SAND’s next direction. If buyers step in and reclaim key resistance levels, a major rally could unfold. On the other hand, failure to hold support could extend the ongoing correction. Investors and traders will be closely watching this retest to gauge the next move in SAND’s price action.

Disclaimer: This article is for informational purposes only and does not constitute financial advice. Always conduct your own research before making any investment decisions.


0

Disclaimer: The content of this article solely reflects the author's opinion and does not represent the platform in any capacity. This article is not intended to serve as a reference for making investment decisions.

PoolX: Earn new token airdrops
Lock your assets and earn 10%+ APR
Lock now!

You may also like

Trump’s Courtroom Showdown Threatens 112-Year Fed Independence Streak

- Trump's attempt to remove Fed Governor Lisa Cook, the first Black woman in the role, risks undermining the central bank's 112-year independence tradition. - Legal experts challenge Trump's authority to fire Cook without proven misconduct, warning politicization could erode Fed credibility and trigger inflation, currency depreciation, and foreign investment losses. - A Trump-aligned Fed board could prioritize short-term political gains over data-driven policies, repeating historical risks seen during Nixo

ainvest2025/08/31 23:18
Trump’s Courtroom Showdown Threatens 112-Year Fed Independence Streak

The Rare RSI Signal and Altcoin Breakout: Is Now the Time to Rebalance into High-Beta Altcoins?

- Bitcoin dominance drops below 60% for first time since 2021, historically signaling altcoin market shifts as ETH/BTC ratio hits 0.05 threshold. - Altcoin RSI hits oversold levels (<30) mirroring 2017/2021 bull cycles, with Ethereum showing bullish divergence and $27.6B institutional inflows in Q3 2025. - Solana, Cardano trade at oversold levels with strong accumulation patterns, while macro factors like Fed rate cuts and Bitcoin ETF inflows create favorable risk-on environment. - Market suggests capital

ainvest2025/08/31 23:00
The Rare RSI Signal and Altcoin Breakout: Is Now the Time to Rebalance into High-Beta Altcoins?

Hyperliquid's Uptrend: Technical Analysis and Trader Sentiment Signal Breakout Potential

- Hyperliquid (HYPE) consolidates at $44–$45, a critical support zone amid recent volatility. - Technical indicators suggest potential for a $49–$50 breakout or $38–$40 correction based on key level holds. - Whale activity and $106M buybacks stabilize price, but leveraged shorts create short-term uncertainty. - A sustained $49 close could target $60–$70, while breakdown below $43.13 risks renewed selling pressure.

ainvest2025/08/31 23:00
Hyperliquid's Uptrend: Technical Analysis and Trader Sentiment Signal Breakout Potential