ADA Price Breaks Key Resistance: Is Cardano Set for a Major Rally?

Cardano (ADA) is turning heads again. After a prolonged consolidation phase, ADA is showing fresh signs of bullish momentum. The altcoin surged past a key resistance zone and is trading around $0.79 at the time of writing. With institutional interest growing in smart contract platforms and ADA’s strong fundamentals , many investors are watching closely to see if this could be the beginning of a larger trend. Let's dive into the charts to uncover what’s next for Cardano.
Cardano Price Prediction: Bullish Breakout Brewing
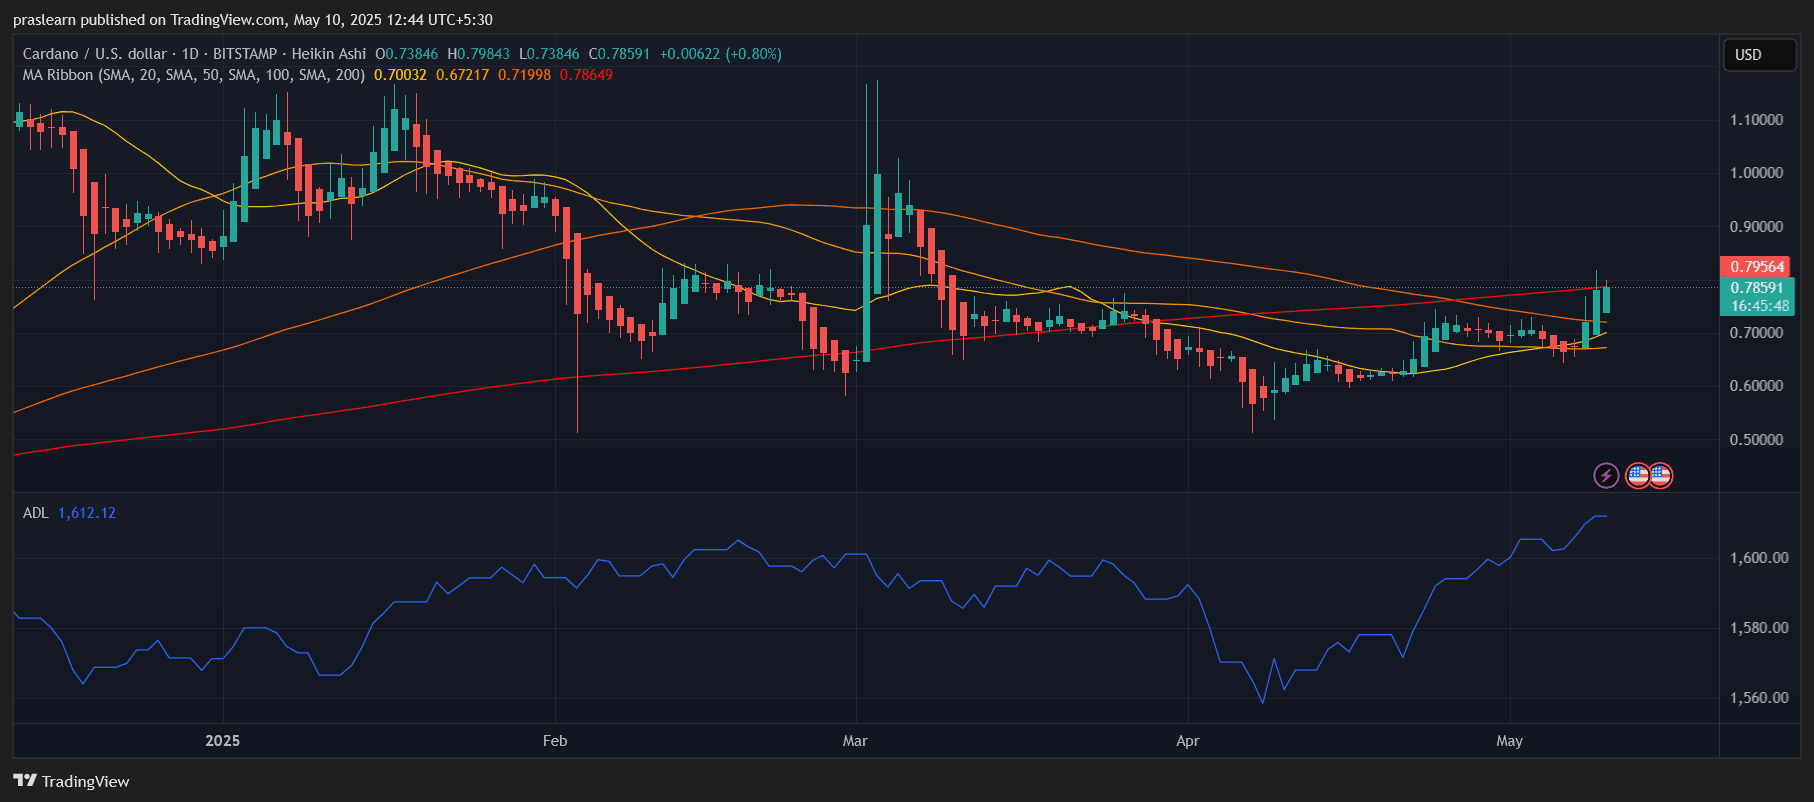 ADA/USD 1 Day Chart- TradingView
The daily chart presents a strong bullish development. ADA price has broken above its 50-day simple moving average (SMA), currently around $0.72, and is now eyeing a close above the 100-day SMA at $0.78. This is the first decisive move above the major moving averages in over two months. The recent candle shows a clear bullish engulfing pattern, coupled with higher volume and momentum, indicating strong buying pressure.
The ADL (Accumulation/Distribution Line) is sloping upward, confirming that accumulation is underway. The next significant resistance lies near the 200-day SMA at approximately $0.79–$0.80. A close above this level would trigger a broader breakout with potential targets toward $0.88 and $1.00 in the coming weeks.
Hourly Chart Insights: Momentum Gaining Traction
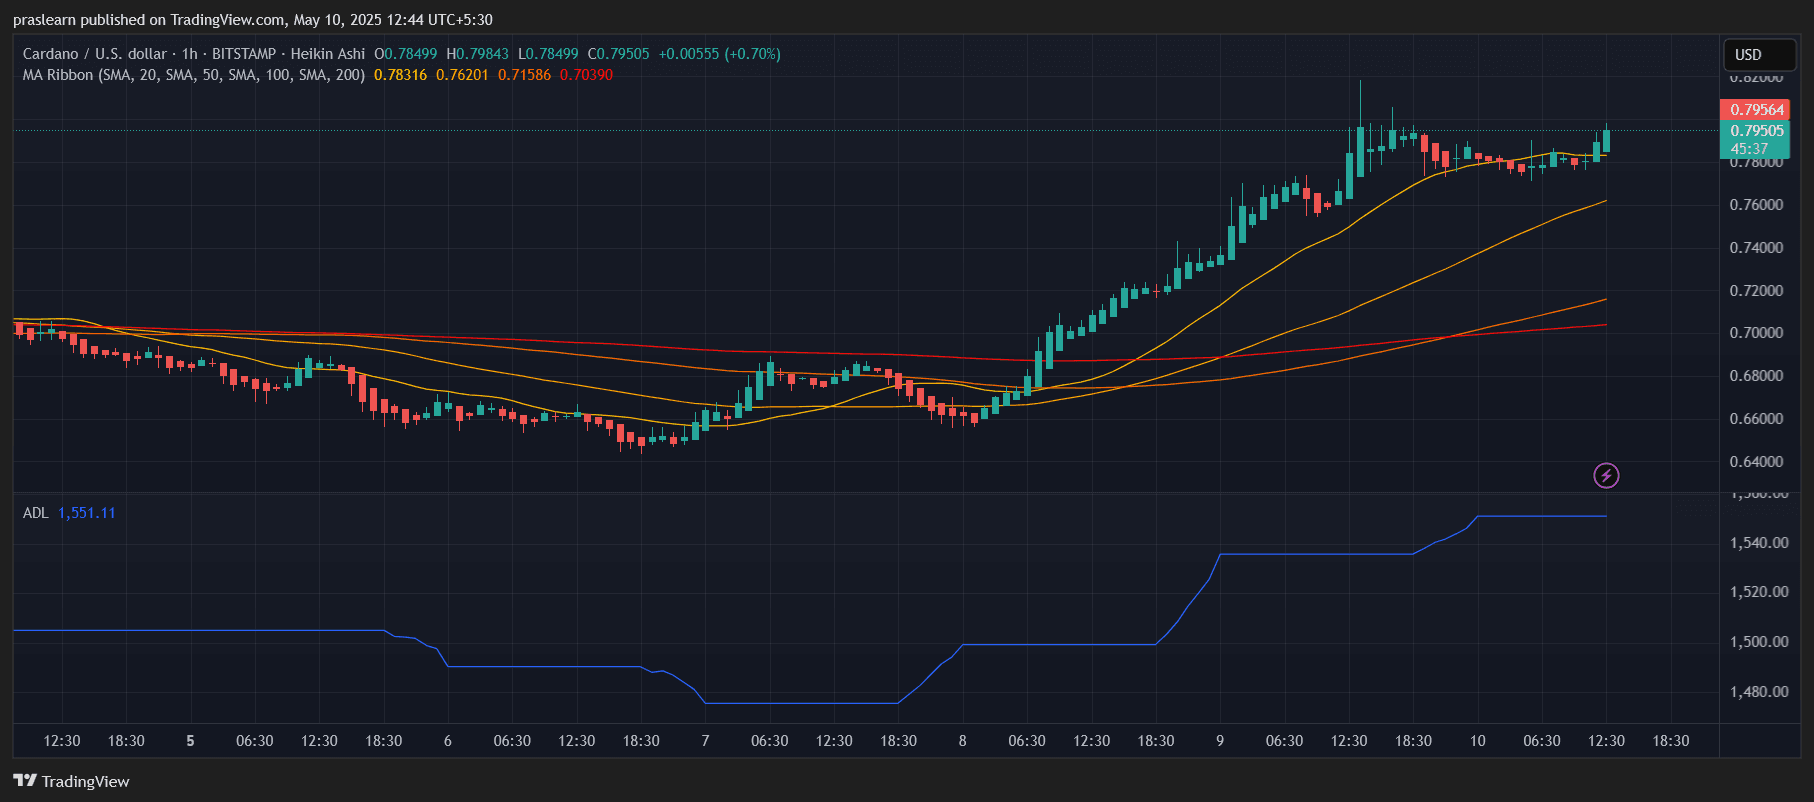 ADA/USD 1 Hr Chart- TradingView
Zooming into the hourly chart, ADA price is riding a strong uptrend that began around the $0.70 mark. The price action is consistently making higher highs and higher lows, a classic bullish structure. The ribbon of moving averages is aligned in bullish order — the 20, 50, and 100 SMAs are all stacked above the 200 SMA.
The most recent hourly candles show a minor consolidation just below $0.80, suggesting a potential flag or pennant formation, which typically leads to continuation. If ADA manages to flip $0.80 into support, intraday traders could see upside targets at $0.82 and $0.85 in the short term.
Cardano Price Prediction and Outlook
If Cardano price maintains momentum and closes above $0.80 on the daily time frame, it opens the door to test the $1.00 psychological level, which also aligns with prior structure resistance. The technicals suggest that the bullish trend may have just begun. On the downside, support lies around $0.74, followed by a stronger level near $0.70.
Conclusion
Cardano is displaying renewed bullish strength after months of sideways trading. Both the daily and hourly charts indicate a trend reversal backed by volume and moving average alignment. With broader crypto market optimism and Cardano’s increasing DeFi adoption, ADA could be gearing up for a strong rally. Traders should monitor $0.80 for a potential breakout confirmation and place stop-losses below $0.74 to manage risk.
Disclaimer: The content of this article solely reflects the author's opinion and does not represent the platform in any capacity. This article is not intended to serve as a reference for making investment decisions.
You may also like
IOTA partners with top global institutions to build Africa’s “digital trade superhighway”: a new $70 billion market is about to explode
Africa is advancing trade digitalization through the ADAPT initiative, integrating payment, data, and identity systems with the goal of connecting all African countries by 2035. This aims to improve trade efficiency and unlock tens of billions of dollars in economic value. Summary generated by Mars AI. The accuracy and completeness of this summary are still being iteratively updated.

Panic selling is all wrong? Bernstein: The real bull market structure is more stable, stronger, and less likely to collapse
Bitcoin has recently experienced a significant 25% pullback. Bernstein believes this was caused by market panic over the four-year halving cycle. However, the fundamentals have changed: institutional funds such as spot ETF are absorbing the selling pressure, and the structure of long-term holdings is more stable. Summary generated by Mars AI. The accuracy and completeness of this content are still being iteratively improved.
Young Bitcoin holders panic sell 148K BTC as analysts call for sub-$90K BTC bottom
Rare Bitcoin futures signal could catch traders off-guard: Is a bottom forming?