
XRP Traders Bet on Reversal as Demand Builds at Key Support

Despite a recent 4% dip, XRP shows signs of a rebound fueled by strong trader interest and bullish technical indicators. Liquidation targets at $2.48 may drive near-term price action
XRP has slipped 4% over the past week amid a broader market pullback. As of this writing, the fourth-largest cryptocurrency by market capitalization trades at $2.31.
Amid strengthening bearish bias across the general market, on-chain data hints at a near-term rebound.
XRP Gears Up for Potential Rally
According to Coinglass, XRP’s liquidation heatmap shows a notable concentration of liquidity at the $2.48 price zone.
Liquidation heatmaps are visual tools traders use to identify price levels where large clusters of leveraged positions are likely to be liquidated. These maps highlight areas of high liquidity, often color-coded to show intensity, with brighter zones representing larger liquidation potential.
Usually, these price zones act as magnets for price action, as the market tends to move toward these areas to trigger liquidations and open fresh positions.
Therefore, for XRP, the cluster of liquidity at the $2.48 price level signals strong trader interest in buying or closing short positions at that price. This opens the door for a potential price rally in the near term.
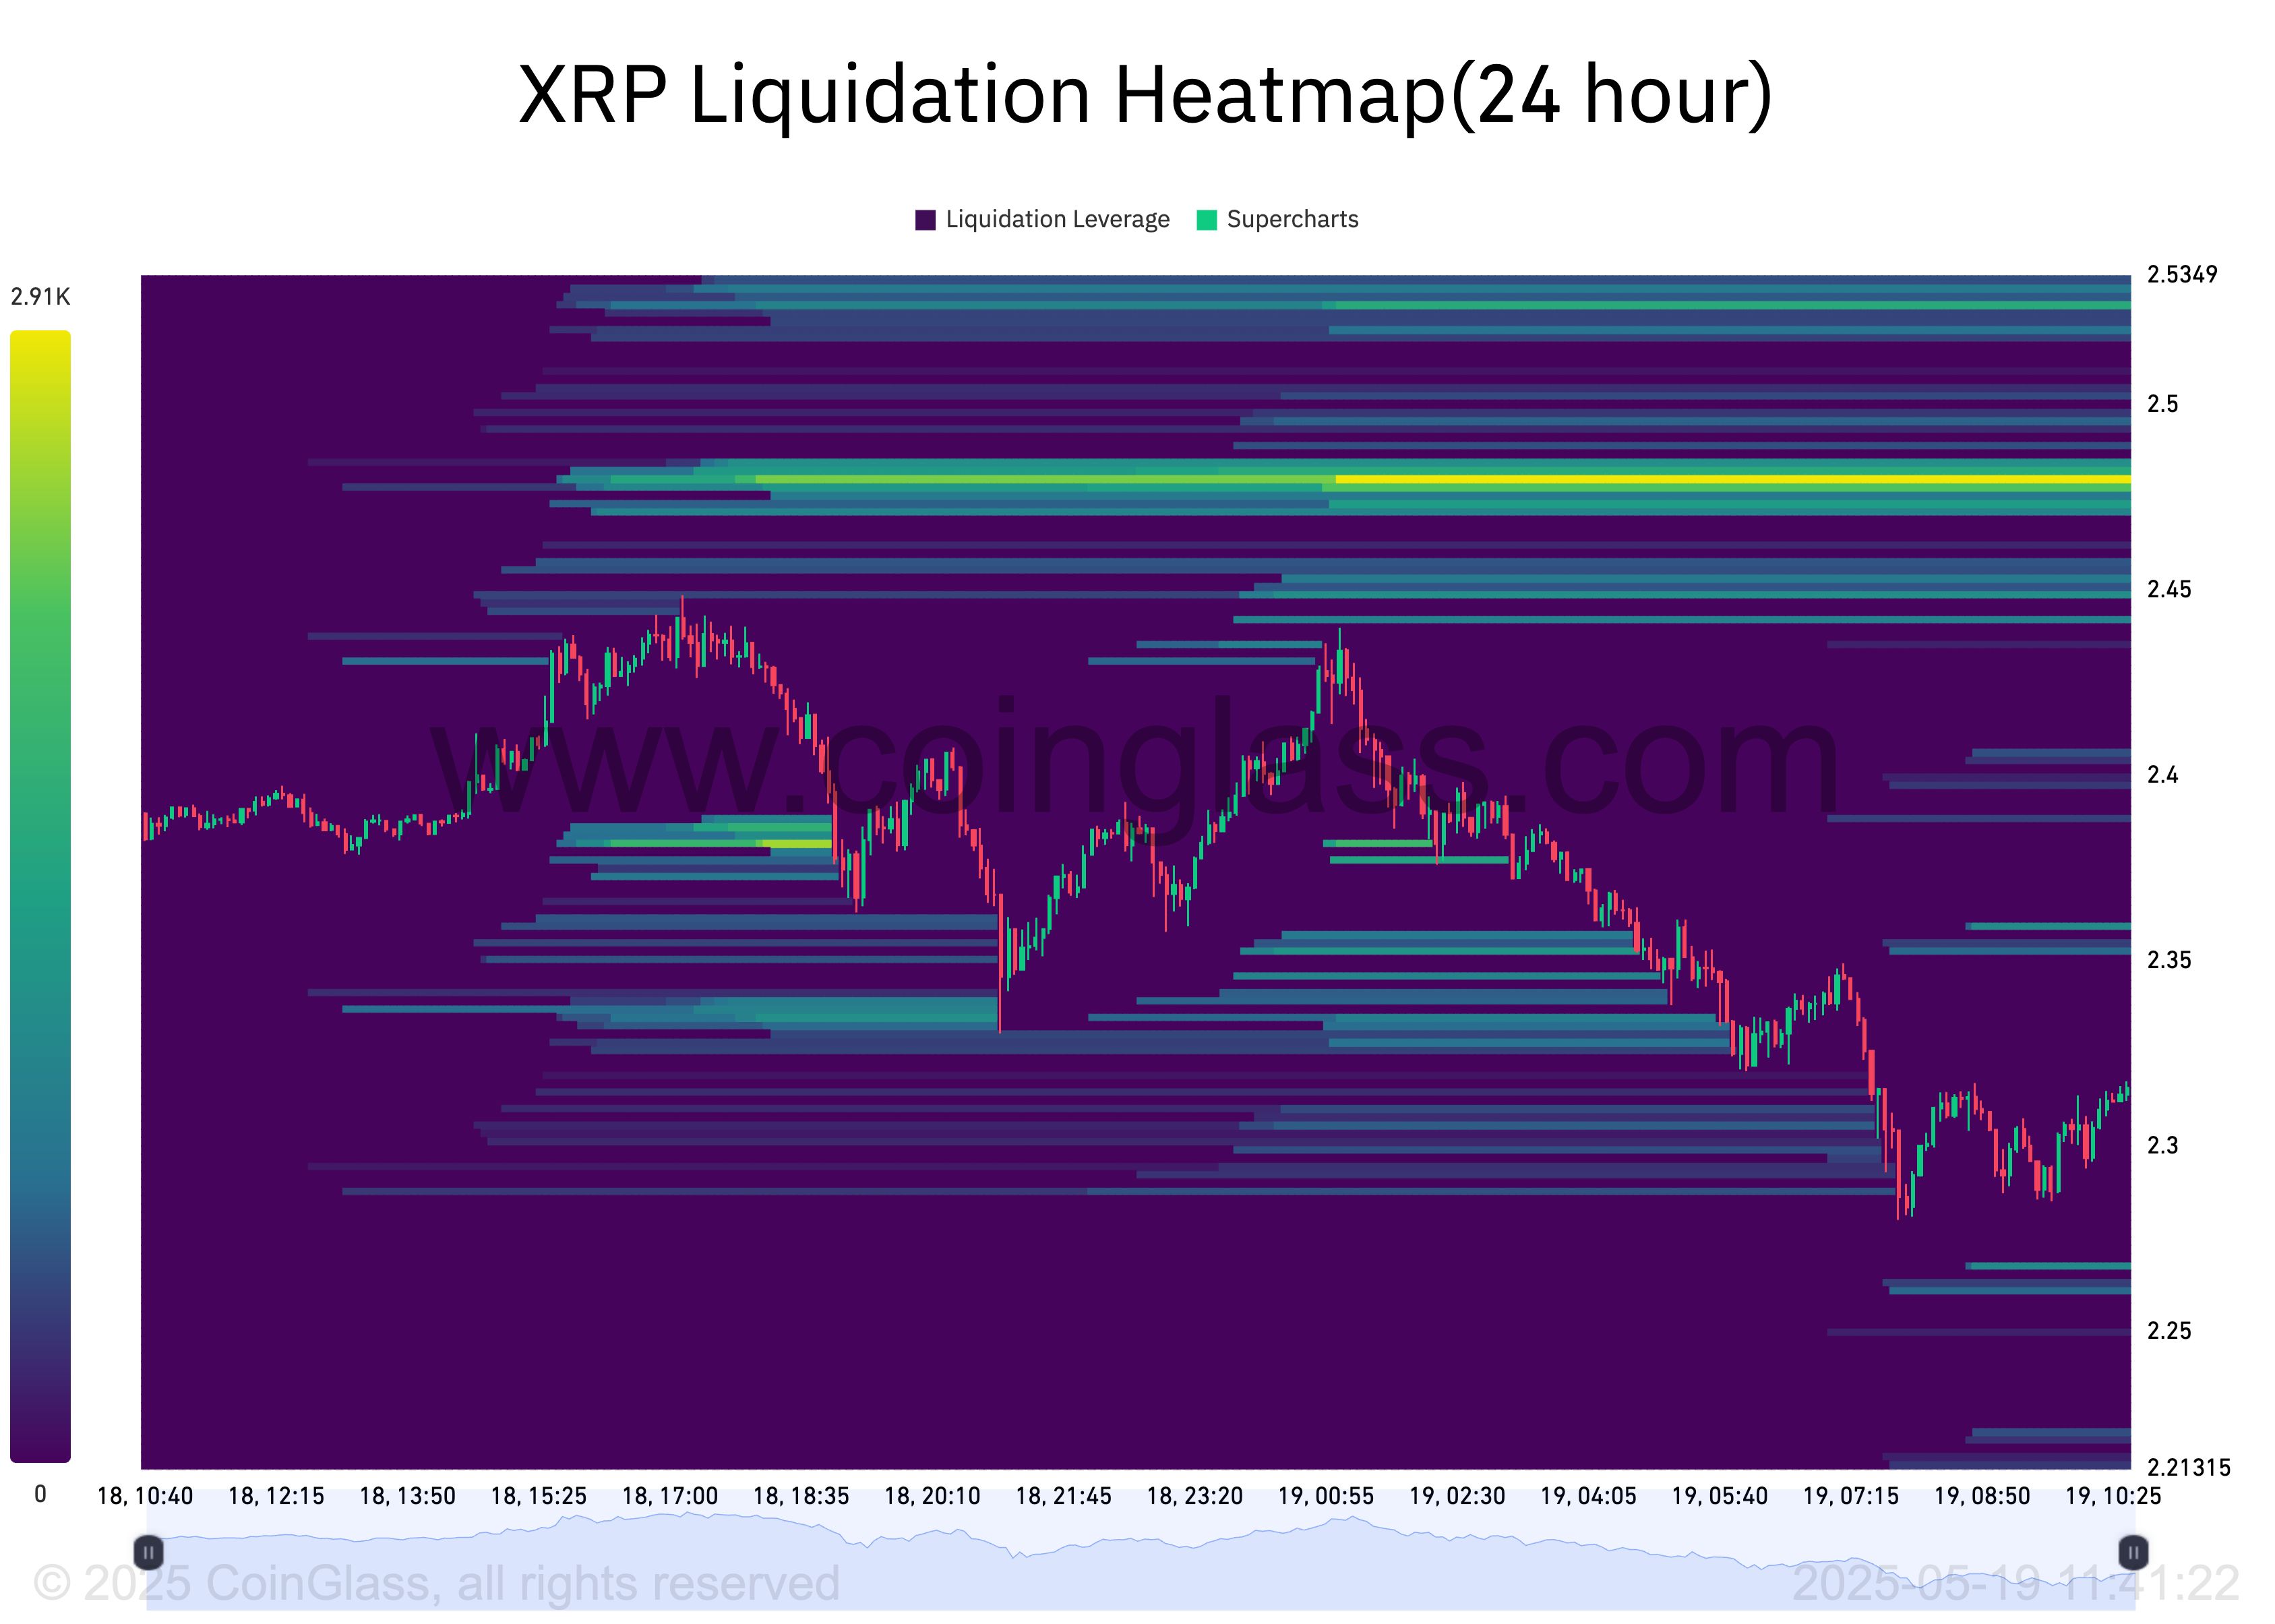 XRP Liquidation Heatmap. Source:
Coinglass
XRP Liquidation Heatmap. Source:
Coinglass
Further, the altcoin’s funding rate has remained positive despite its recent headwinds. Currently, this stands at 0.0041%.
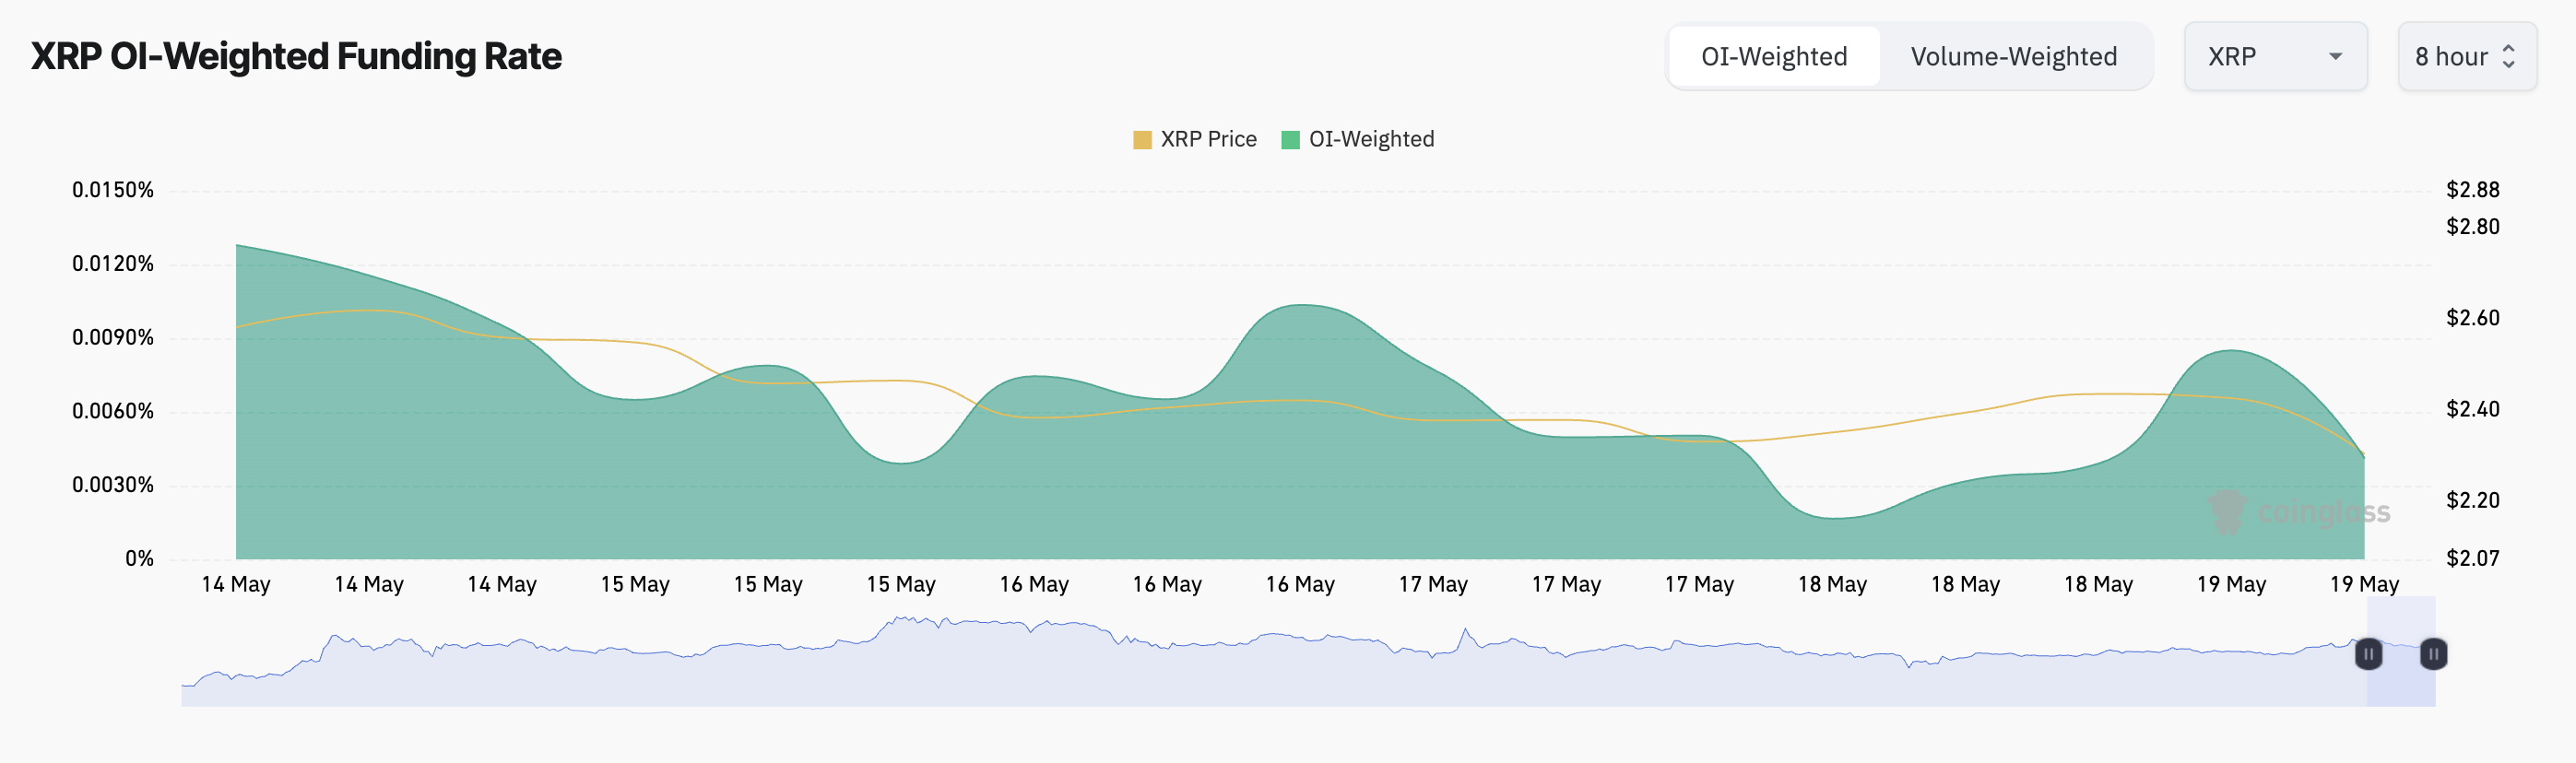 XRP Funding Rate. Source:
Coinglass
XRP Funding Rate. Source:
Coinglass
The funding rate is a periodic payment between traders in perpetual futures contracts to keep the contract price aligned with the spot price. When the funding rate is positive, there is a higher demand for long positions. This means that more traders are betting on XRP’s price going up.
XRP Bulls Take Charge
On the daily chart, XRP’s Directional Movement Index (DMI) highlights the growing demand for the altcoin. At press time, the token’s positive directional index (+DI) rests above the negative directional index (-DI).
The DMI indicator measures the strength of an asset’s price trend. It consists of two lines: the +DI, which represents upward price movement, and the -DI, which means downward price movement.
As with XRP, the market trend is bullish when the +DI rests above the -DI. If this persists, the token’s price could surge to $2.50.
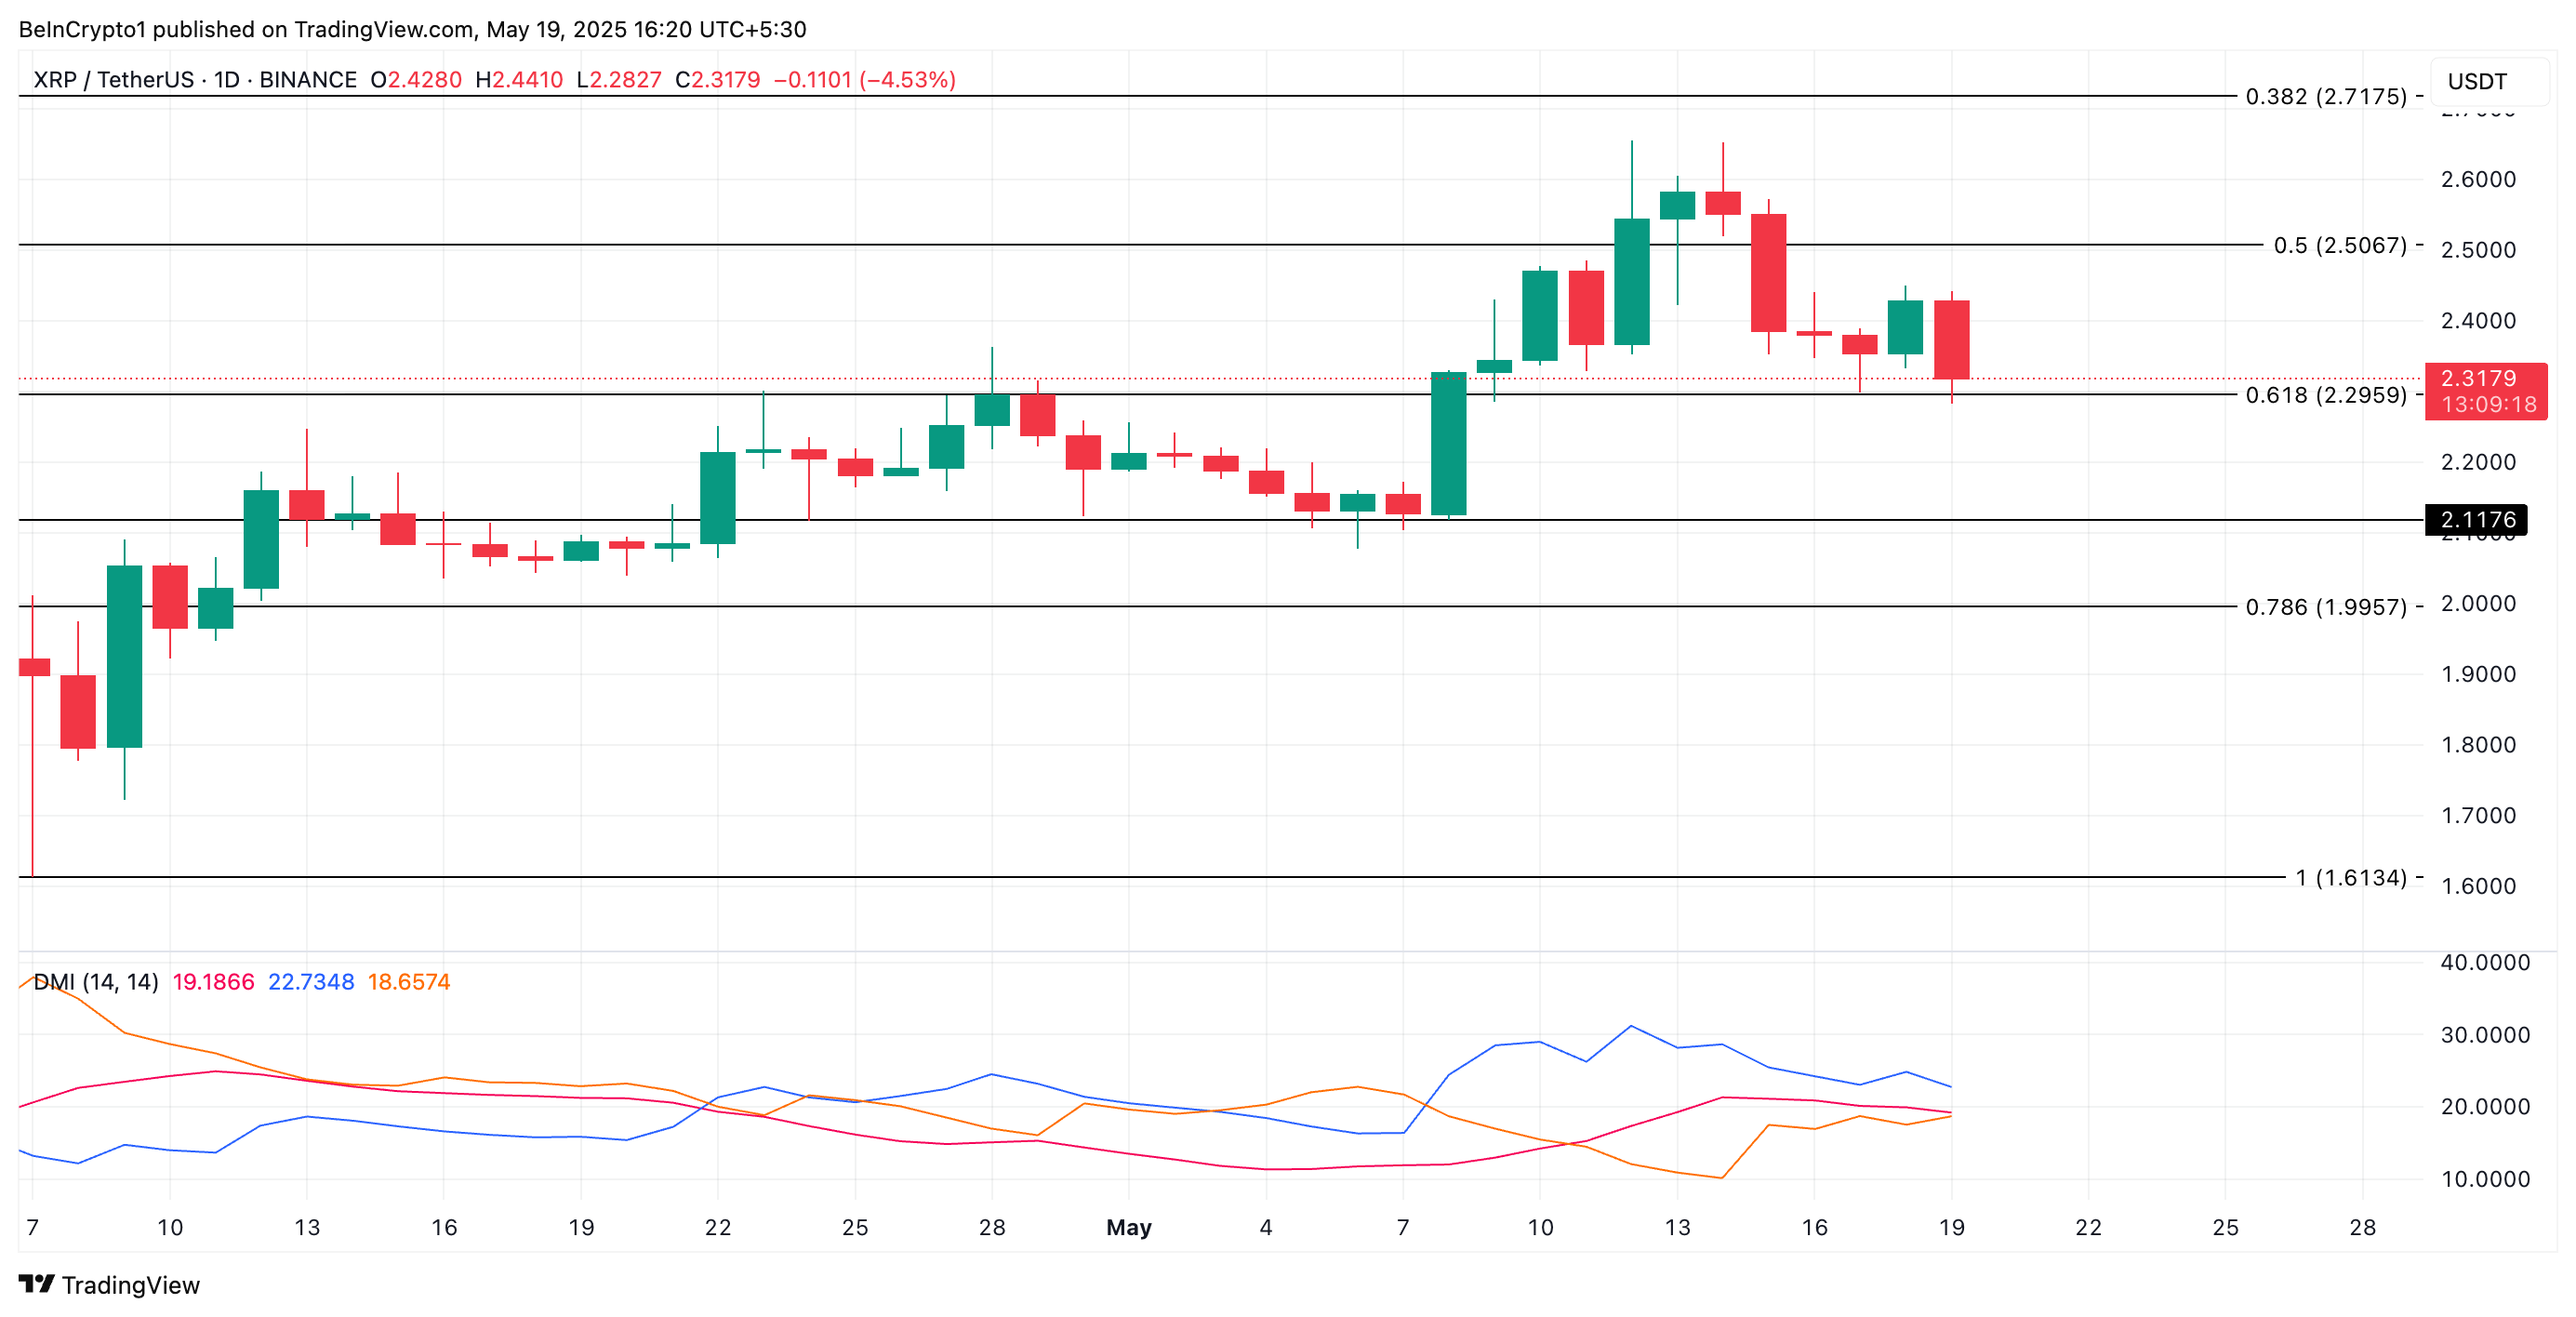 XRP Price Analysis. Source:
TradingView
XRP Price Analysis. Source:
TradingView
However, if the XRP token price drop continues, its value could fall below $2.29, and trend toward $2.11.
Disclaimer: The content of this article solely reflects the author's opinion and does not represent the platform in any capacity. This article is not intended to serve as a reference for making investment decisions.
You may also like
Has the four-year cycle of Bitcoin failed?
The various anomalies in this cycle—including waning sentiment, weakening returns, disrupted rhythms, and institutional dominance—have indeed led the market to intuitively feel that the familiar four-year cycle is no longer effective.
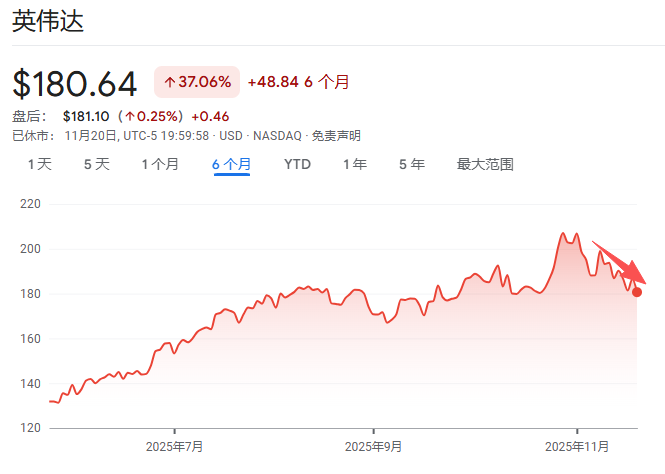
At an internal Nvidia meeting, Jensen Huang admitted: It's too difficult. "If we do well, it's an AI bubble," and "if we fall even slightly short of expectations, the whole world will collapse."
Jensen Huang has rarely admitted that Nvidia is now facing an unsolvable dilemma: if its performance is outstanding, it will be accused of fueling the AI bubble; if its performance disappoints, it will be seen as evidence that the bubble has burst.
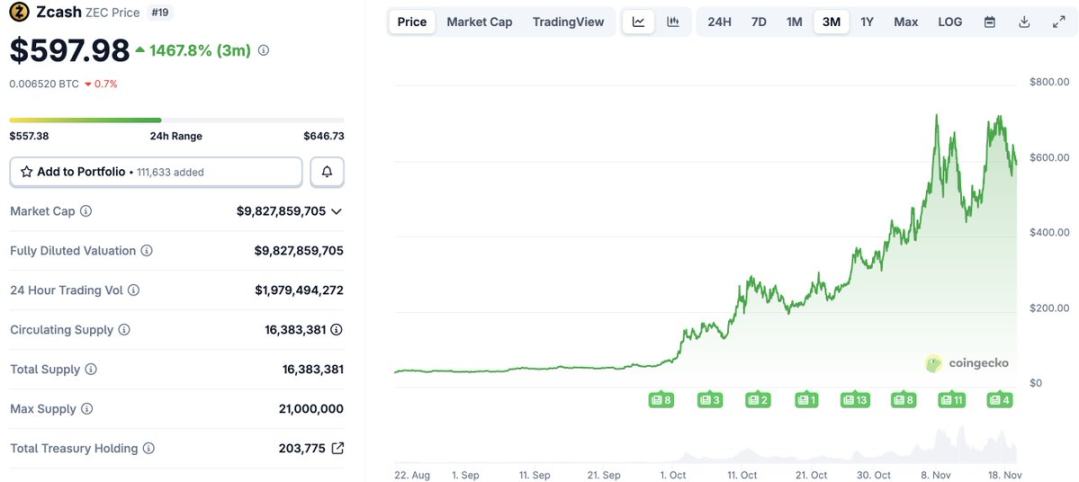
After a 1460% Surge: Reassessing the Value Foundation of ZEC
Narratives and sentiment can create myths, but fundamentals determine how far those myths can go.
The demise of a DAT company
The $1 billion Ethereum DAT plan led by Li Lin and others has been shelved due to the bear market, and funds have been returned. This "going with the flow" approach may reflect consideration of investor sentiment.