-
Pi Network (PI) has experienced a significant decline of nearly 15% over the past week, with technical indicators confirming a bearish trend fueled by increasing selling pressure.
-
As the Chaikin Money Flow (CMF) plunges to -0.20, its lowest level since mid-May, it highlights strong capital outflows and ongoing distribution from the asset.
-
The bearish Exponential Moving Average (EMA) structure remains in play, with critical support at $0.66 that, if breached, could see prices fall to $0.57.
The Pi Network (PI) sees a sharp decline of 15% in a week, signaling a stronger bearish trend as key indicators indicate intensified selling pressure and potential further downside.
PI Network’s Bearish Trend Strengthens
The Directional Movement Index (DMI) chart for Pi Network (PI) indicates a significant increase in the Average Directional Index (ADX), rising to 21 from 11.46 within just one day.
The ADX assesses the strength of a trend without regard to direction. An ADX reading below 20 traditionally suggests a weak or stagnant market, while levels above 20 signify that a trend is gaining strength.
With PI’s ADX now surpassing this crucial threshold, it implies that a more definitive move—either bullish or bearish—may be on the horizon.
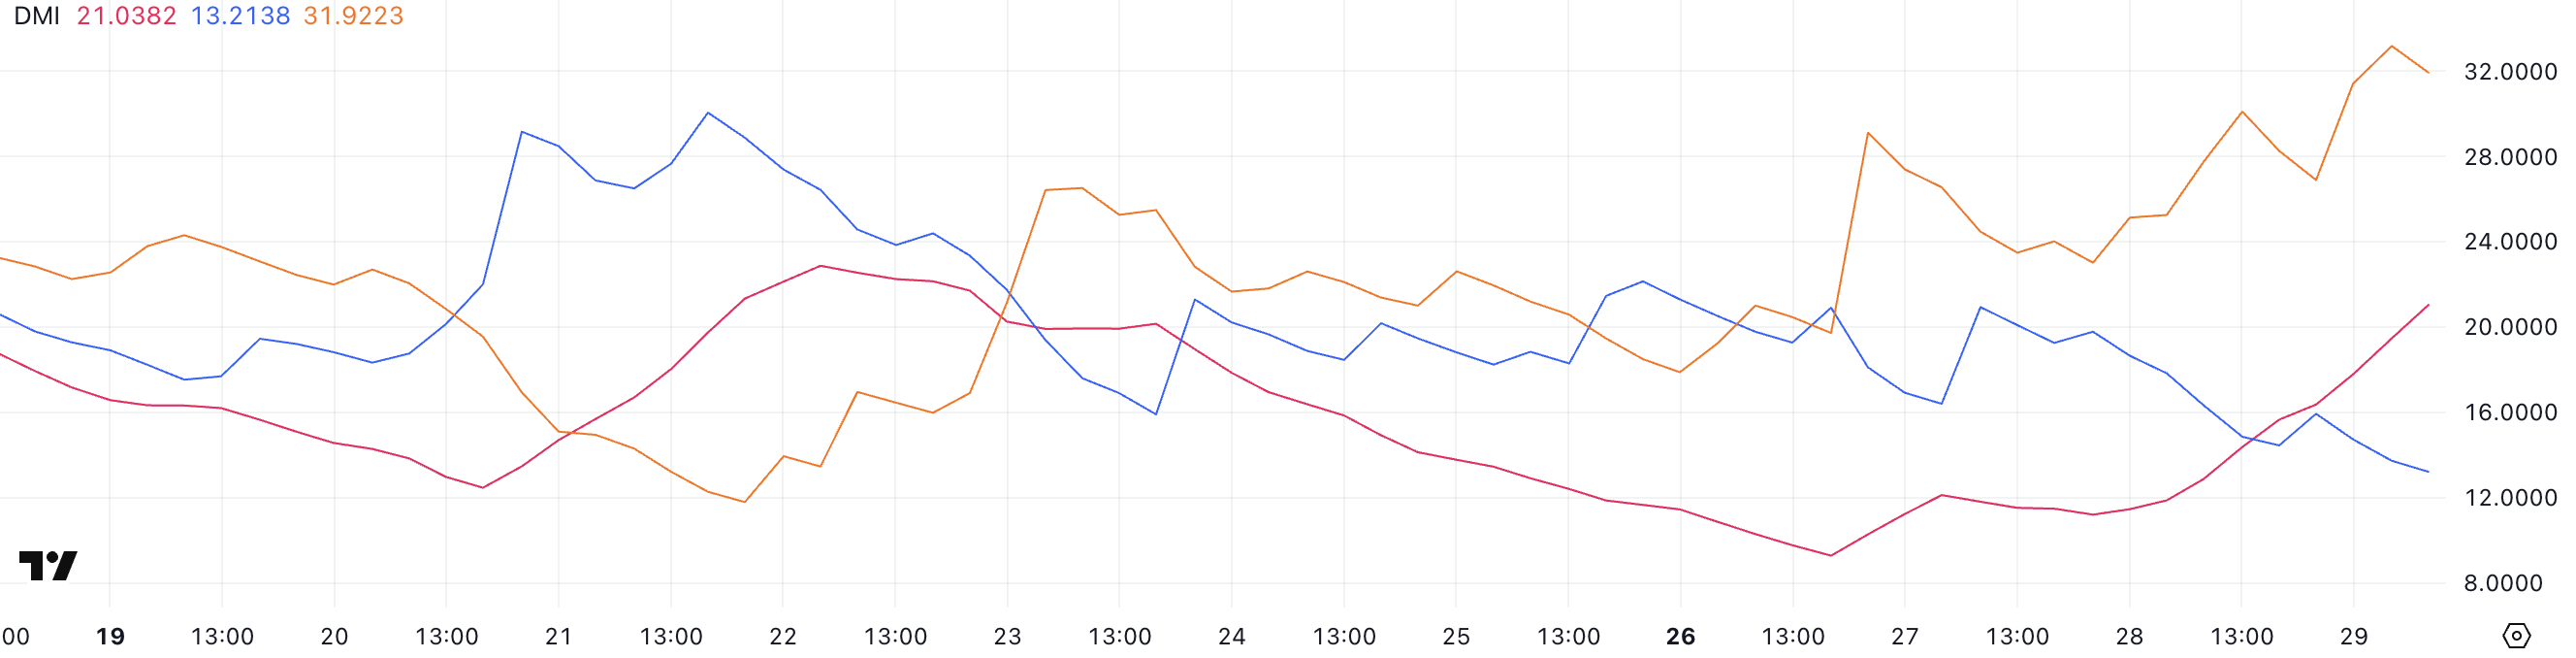
Delving deeper, the +DI (Positive Directional Indicator) has fallen to 13.21 from 20.93, while the -DI (Negative Directional Indicator) has surged to 31.92 from 23.48.
This widening gap indicates increasing downward pressure on PI. A rising -DI in conjunction with a strengthening ADX typically confirms that a bearish trend is gaining momentum.
In summary, the indicators align to suggest that PI may be transitioning into a stronger downtrend, prompting traders to closely monitor forthcoming price action.
Indicators Show Strong Selling Pressure
The Chaikin Money Flow (CMF) for Pi Network (PI) has dropped sharply to -0.20, a significant decline from 0.08 three days prior and -0.08 just one day ago.
CMF is a volume-weighted metric that measures monetary flow into and out of an asset over a specific duration, commonly 20 or 21 days.
Configurations above 0 generally suggest accumulation and buying momentum, while values below 0 indicate selling pressure and distribution. A CMF value exceeding ±0.10 is deemed notable, with deeper negatives suggesting persistent outflows.

With PI’s CMF now at -0.20, marking its lowest score since May 17, there is a compelling signal that sellers dominate the market.
This pronounced decrease reflects a growing capital exit from the asset. Combined with recent price weaknesses, it fortifies a bearish outlook.
If the CMF continues its downward trajectory or remains at deeply negative levels, any attempts at price recovery could face considerable resistance due to inadequate bullish volume support.
PI Price Eyes Lower Support
The Exponential Moving Average (EMA) indicators for PI persist in a bearish outlook, with short-term EMAs situated beneath long-term ones, signifying that downward momentum remains dominant.
The widening separation between these EMA lines underscores the prevailing strength of the present downtrend. Should PI continue its descent, the next support level will lie at $0.66, and a breach of this could open the avenue for a further drop toward $0.57.
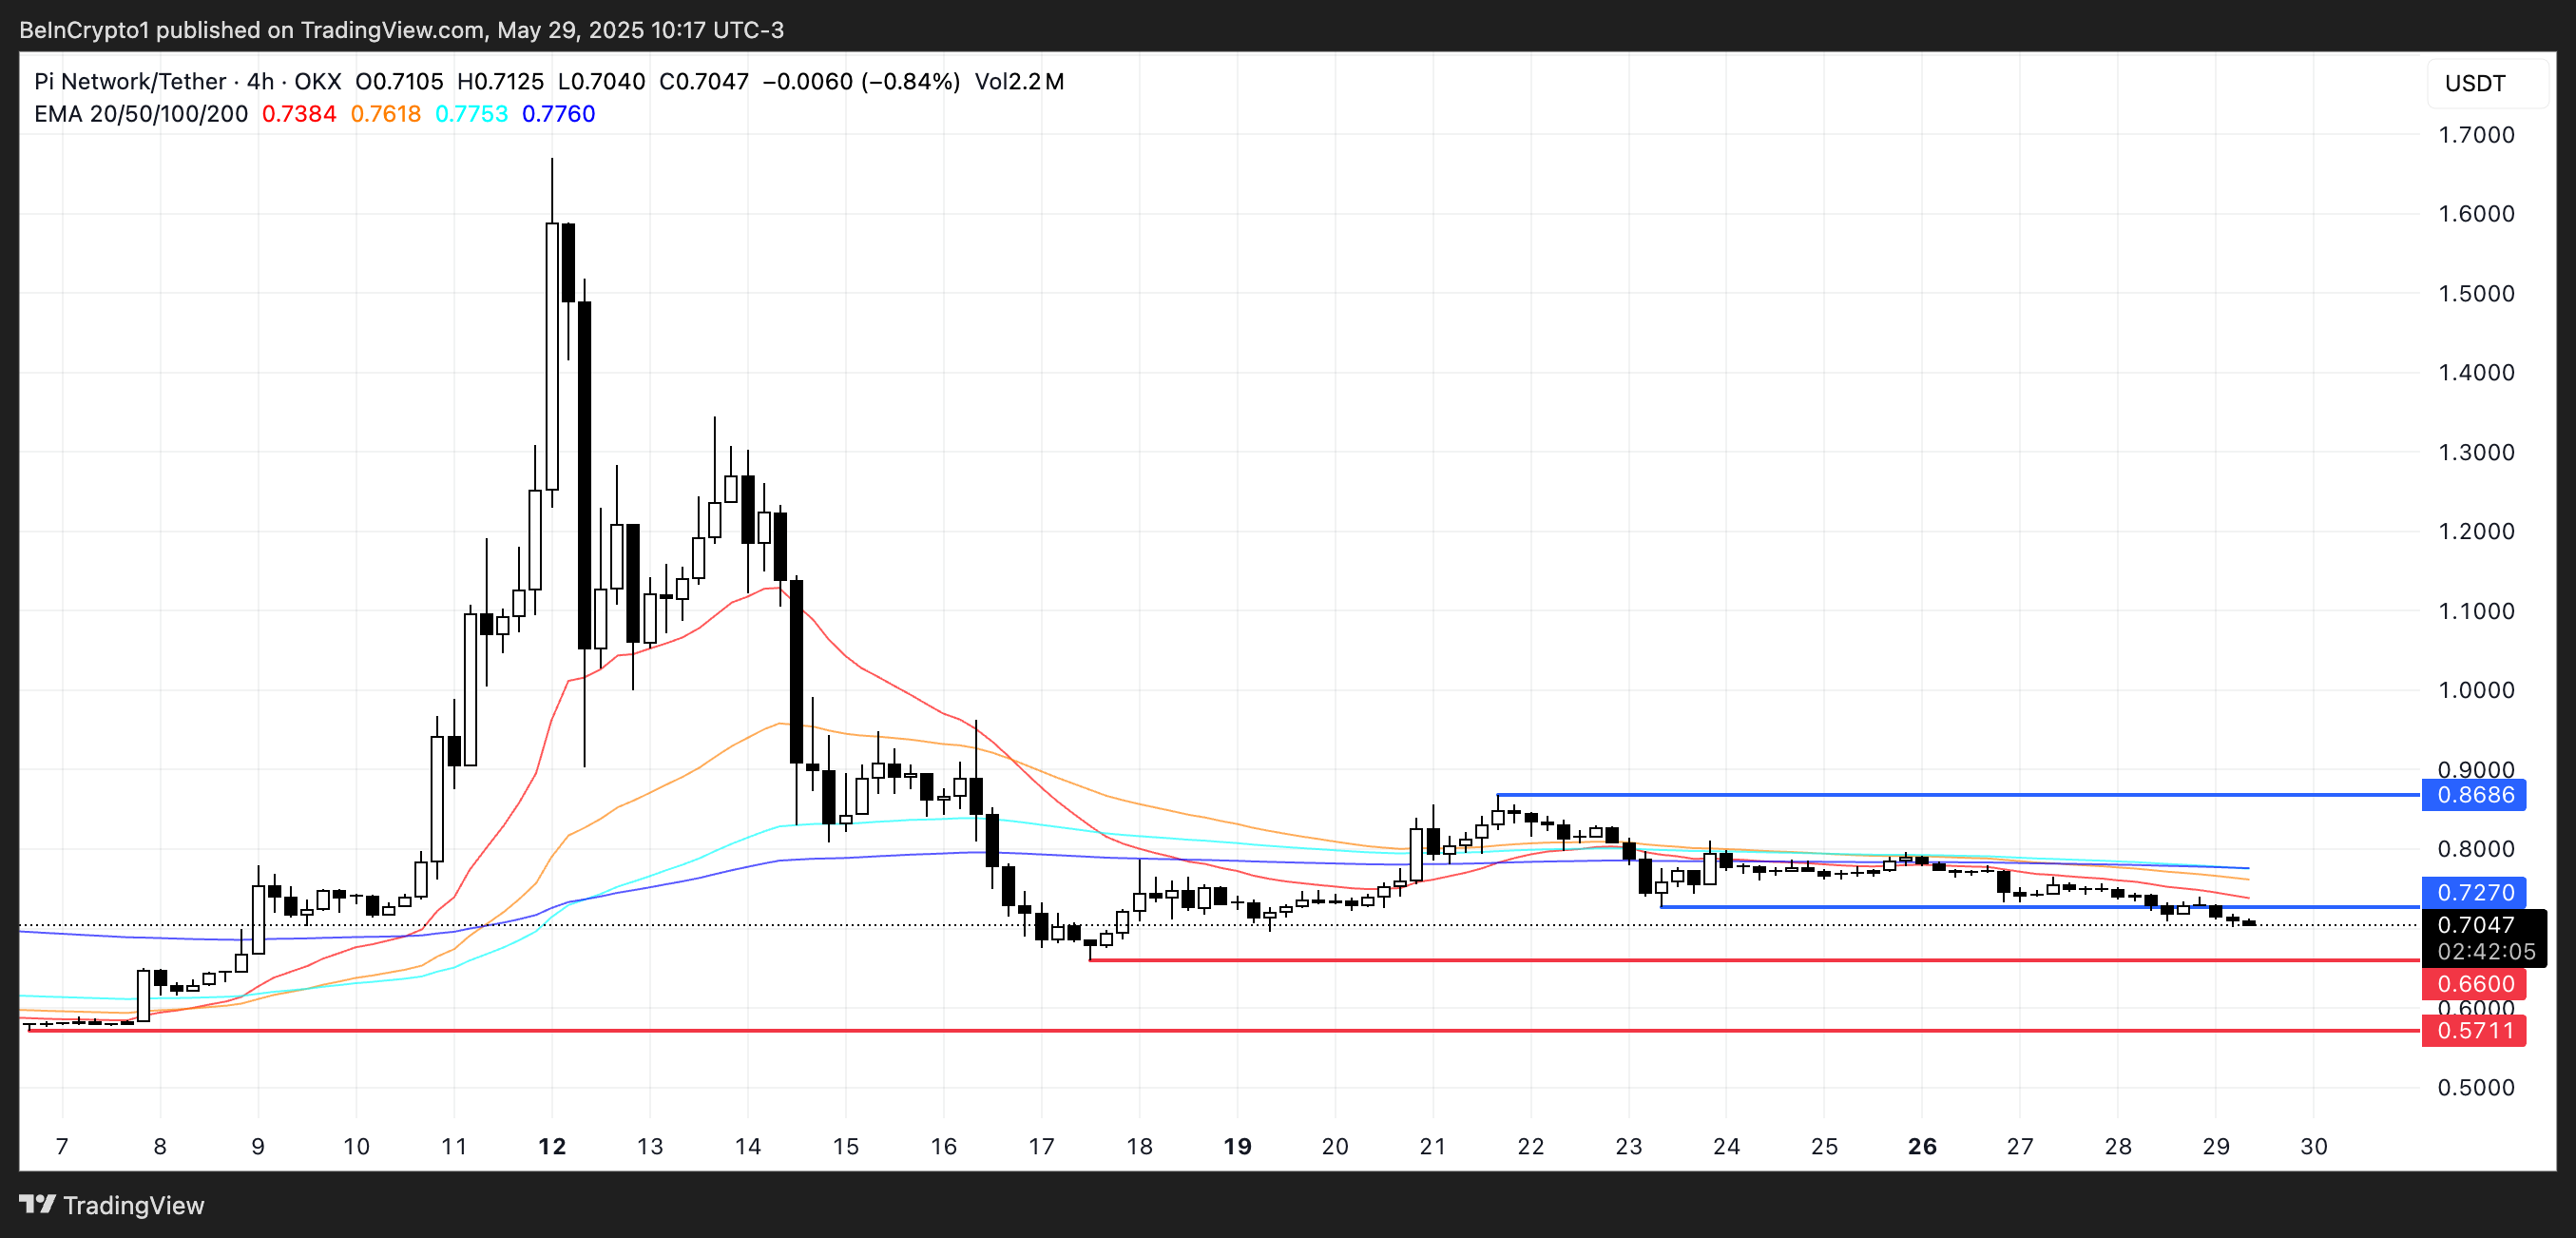
If, conversely, PI manages to reverse its current course, the first significant resistance to monitor is $0.727. Surpassing this level could signify a momentary recovery, potentially pushing the price towards the $0.86 mark.
However, without short-term EMAs flattening or climbing above long-term ones, attempts at bullish recovery may remain susceptible to ongoing selling pressure.
Conclusion
In summary, Pi Network (PI) is currently entrenched in a bearish phase characterized by declining indicators and a lack of bullish momentum. Market participants should remain vigilant of critical support levels and the potential for heightened selling pressure as indicators suggest a more pronounced downward trend may be imminent.