Bitcoin Price Analysis: Is BTC Out of the Woods After 8% Correction?

Bitcoin has faced notable selling pressure at the $111K range, leading to a bearish rejection. Nevertheless, the price lacks sufficient bullish momentum and a deeper correction seems plausible in the mid-term.
Technical Analysis
The Daily Chart
Following its breakout above the previous all-time high at $109K and printing a new peak at $111K, Bitcoin met strong resistance that has sparked notable selling pressure. The failure to sustain momentum above this key psychological level has resulted in a bearish rejection, pushing the asset back below the $109K threshold.
This price action coincided with the sweep of buy-side liquidity resting above the previous swing high, allowing smart money to execute sell orders efficiently. As a result, the market has entered a corrective phase, now approaching the daily fair value gap (FVG) between $97K and $100K. This zone likely holds substantial demand, potentially acting as a support zone that could trigger a bullish reaction.
Should the price stabilize within this FVG, a rebound toward the $111K resistance becomes likely. Conversely, failure to hold this level could pave the way for further downside, with the next key support residing near the $95K region.
The 4-Hour Chart
On the 4-hour timeframe, intensified selling pressure at the $111K resistance has caused BTC to break below its previously maintained ascending price channel. The subsequent pullback toward the broken channel boundary near $108K has confirmed the bearish breakout and suggests weakening momentum.
Currently, the price is consolidating within a critical support-resistance band spanning from $100K to $108K. As long as Bitcoin remains within this range, short-term volatility is expected. However, a decisive breakout, either above $108K or below $100K, will likely set the tone for the next significant move, with either a bullish recovery or an extended correction unfolding based on the breakout direction.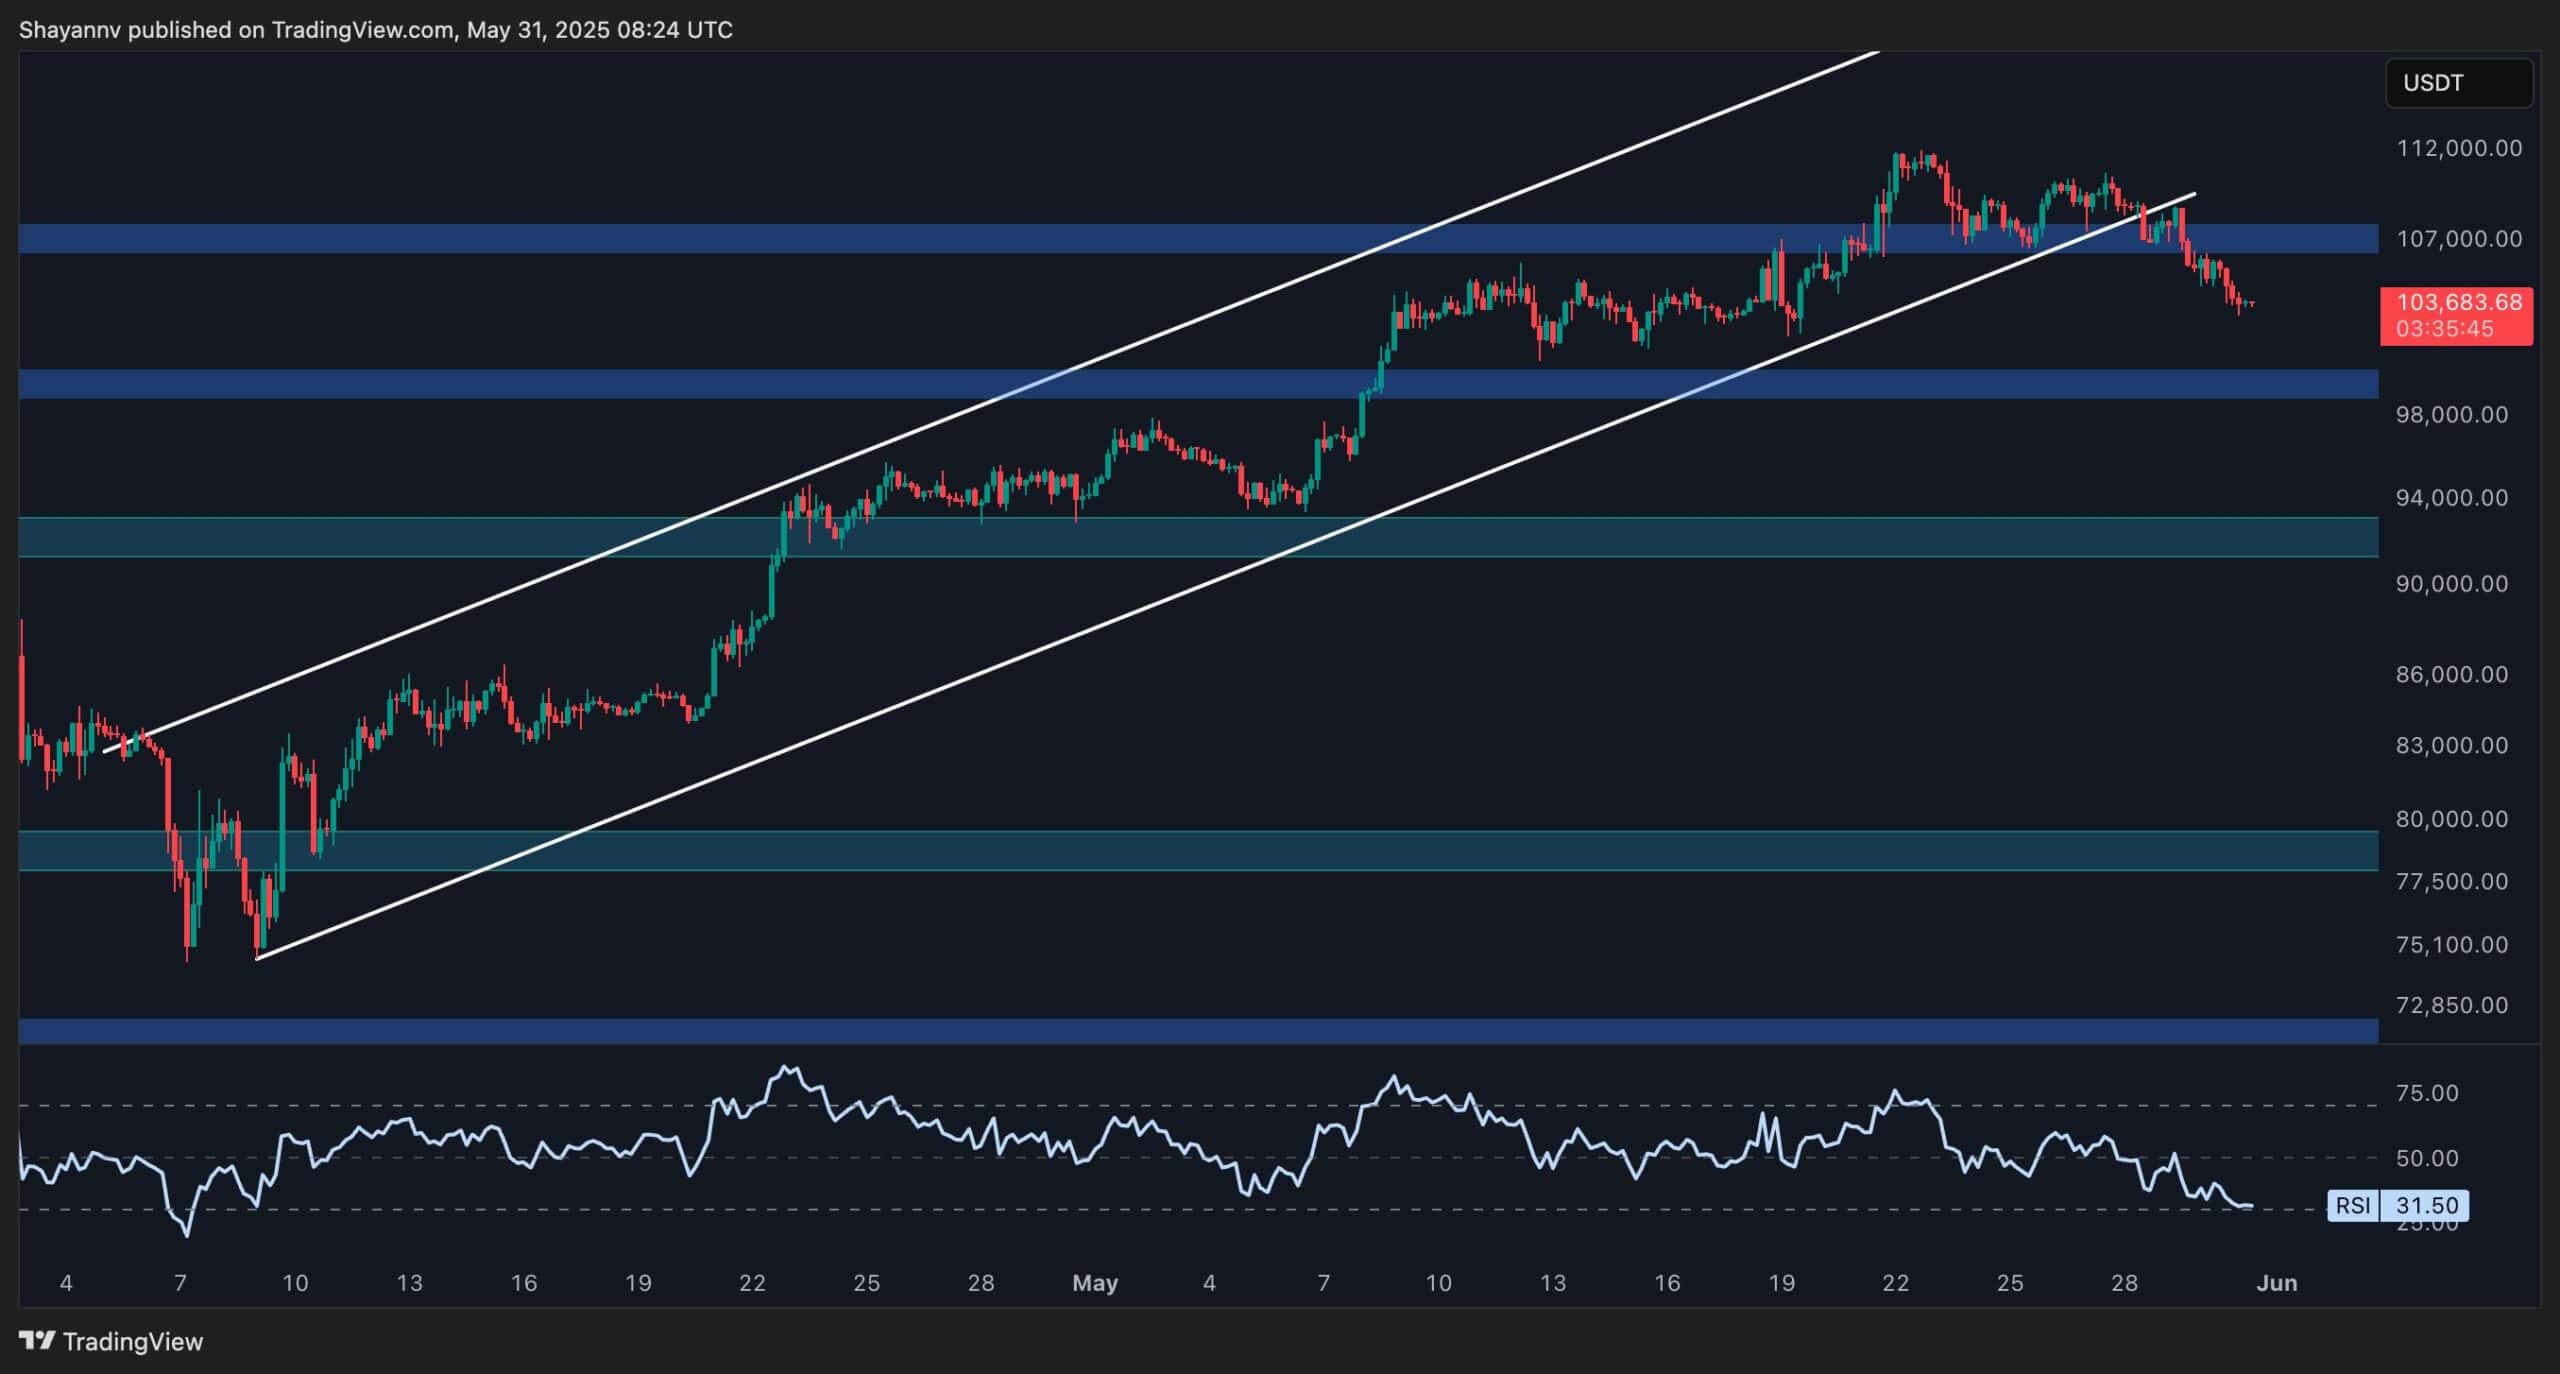
On-chain Analysis
The Realized Price of mid-term holders has consistently functioned as a pivotal support or resistance zone, making it a valuable indicator for gauging broader market sentiment. This metric, representing the average on-chain acquisition cost of UTXOs held by long-term investors, often aligns with key turning points in Bitcoin’s price cycle.
Currently, Bitcoin remains positioned above the Realized Price of the 3–6 month holder cohort, a signal that this group remains in profit and has not faced significant stress. However, recent selling pressure and a rejection from the $111K level have dragged the price closer to the Realized Price of the 3–6 month holder range, which resides around the $98K zone.
This places the $98K–$100K area in the spotlight as a crucial support region. A firm reaction from this zone would confirm continued confidence from mid-term holders and may act as the launchpad for a renewed bullish leg, potentially propelling Bitcoin to fresh all-time highs. Failure to hold this support, however, could shift market sentiment and open the door to deeper corrections.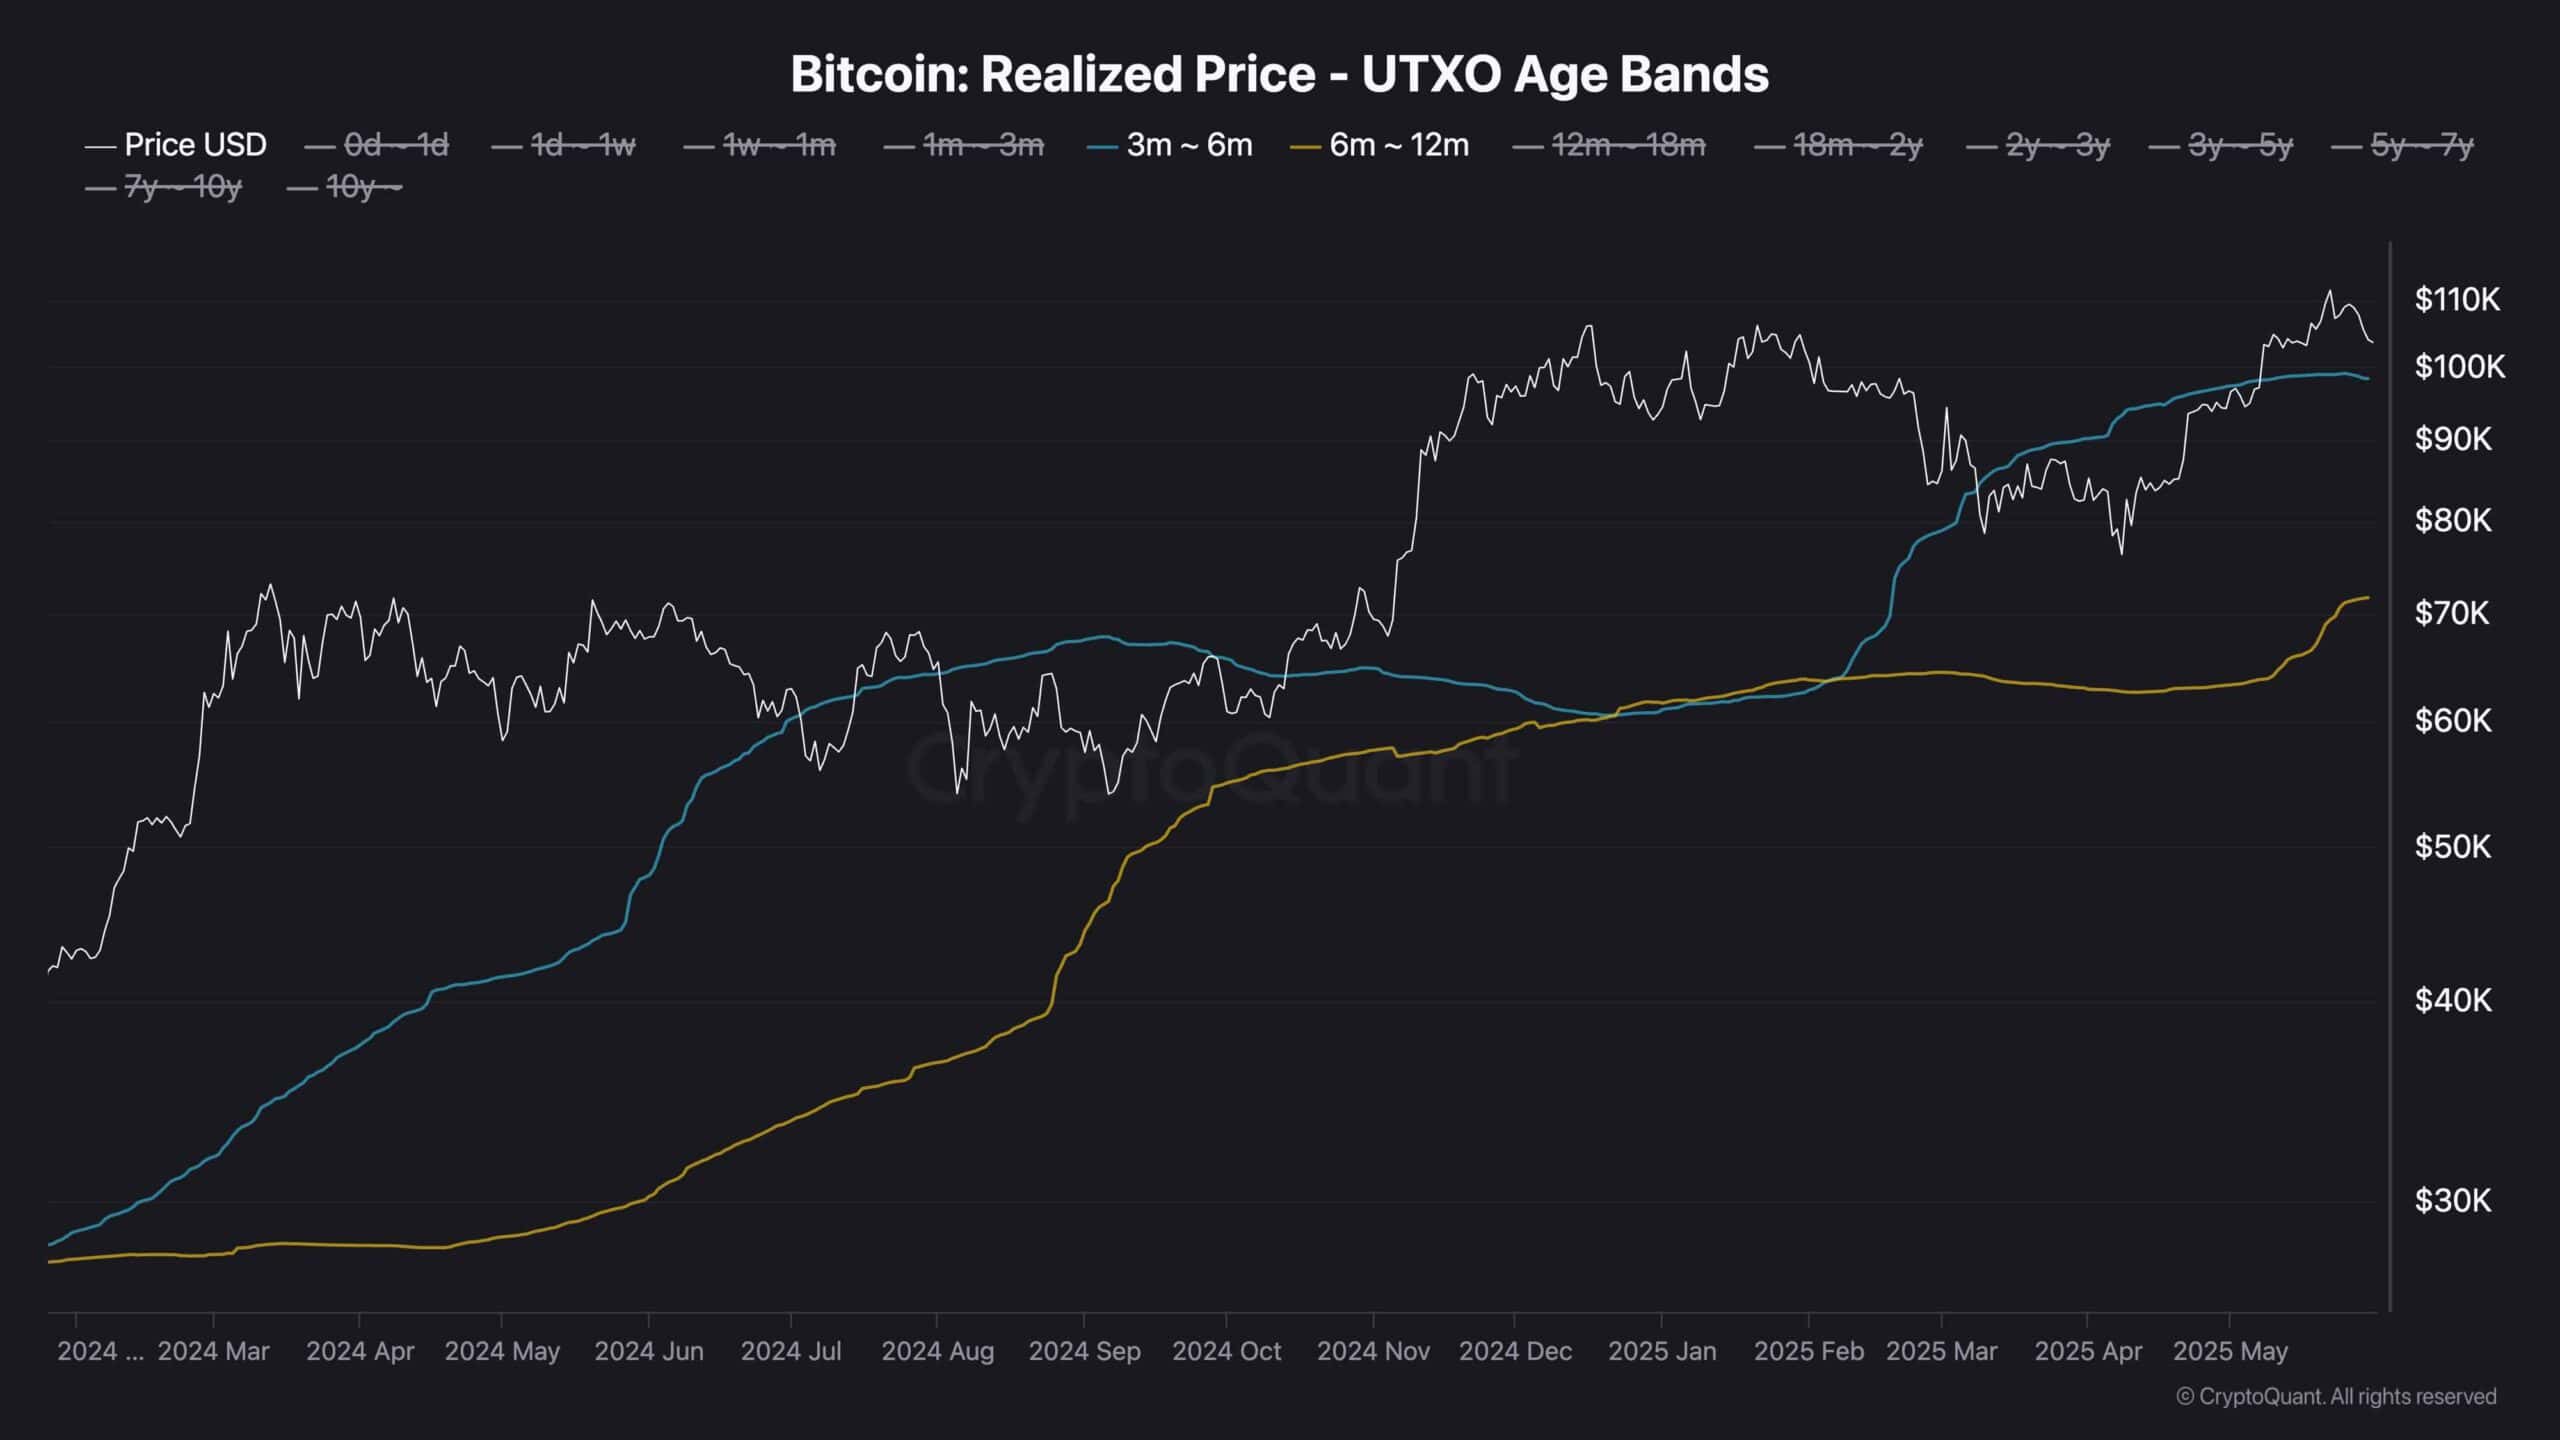
Disclaimer: The content of this article solely reflects the author's opinion and does not represent the platform in any capacity. This article is not intended to serve as a reference for making investment decisions.
You may also like
PENGU USDT Selling Indicator and What It Means for Stablecoin Approaches
- PENGU/USDT's 2025 collapse triggered $128M liquidity shortfall, exposing systemic risks in algorithmic stablecoins. - Technical indicators (RSI 40.8, bearish MACD) and 52.55% 30-day price drop signal deepening market distrust. - Regulatory frameworks (GENIUS Act, MiCA) and AI-driven risk analytics emerge as critical responses to algorithmic vulnerabilities. - Experts urge hybrid models combining CBDC stability with AI governance to address algorithmic stablecoins' inherent fragility.

Hyperliquid (HYPE) Token: Analyzing the Drivers and Longevity Behind Its Latest Price Rally
- Hyperliquid's HYPE token surged to $42.03 in 2025 from $3.20, driven by product upgrades (HyperEVM, HyperCore) and institutional adoption. - Strategic partnerships with Anchorage Digital and Circle , plus regulatory compliance, boosted credibility and decentralized trading volume (73% market share by 2025). - Bitcoin's $123k high in July 2025 correlated with HYPE's peak, reflecting broader crypto market optimism for low-fee decentralized futures infrastructure. - Sustainability risks include token unlock

The Emergence of Hyperliquid: Transforming DeFi Trading with a Novel Approach
- Hyperliquid dominates 73% of decentralized perpetual futures market with $317.6B 2025 trading volume, driven by institutional-grade infrastructure and on-chain innovations. - Platform's CLOB technology enables precise price discovery and sub-second finality, outperforming AMM-based competitors while maintaining DeFi composability. - HYPE token's deflationary model (97% fee buybacks) and institutional partnerships with Anchorage Digital/Circle accelerate liquidity growth and mainstream adoption. - Cross-c

High-Value STEM Initiatives Opening Doors to New Technology Investment Prospects
- High-impact STEM programs aligned with industry needs are key indicators for emerging tech investment opportunities in AI, clean energy, and advanced manufacturing. - U.S. EDA's $500,000 STEM Talent Challenge addresses 449,000 unfilled manufacturing jobs through workforce training and industry partnerships. - Universities like UCLA and Ohio State drive VC growth: 80% success rate in STEM accelerators, with 75% underrepresented founders securing $374M in funding. - Venture capital prioritizes STEM-linked