Date: Sat, Aug 02, 2025 | 11:00 AM GMT
The cryptocurrency market continues its downward pressure as Ethereum (ETH) faced strong resistance near the $3,940 mark, sliding to $3,480 — a 7% daily decline. This sharp pullback has spread throughout the major memecoins , with Dogecoin (DOGE) shedding 16% over the past week and trimming its monthly gains to 14%.
Yet, in the midst of this pullback, something interesting is brewing. DOGE’s price action is beginning to resemble a previous fractal pattern from late 2024 — a setup that once led to a massive bullish rally.
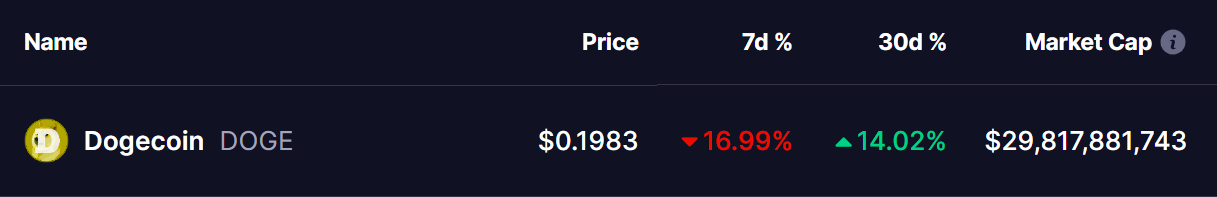 Source: Coinmarketcap
Fractal Setup Hints at a Bullish Reversal
A closer look at the daily chart shows DOGE forming a structure that mirrors the October 2024 fractal.
Back then, DOGE broke above a long-standing downtrend line and reclaimed its 50-day moving average (MA). It then underwent a sharp correction, retesting the 50-day MA as support — a level that held strong and sparked a bullish momentum, eventually pushing DOGE above its 200-day MA. That move snowballed into a spectacular 376% rally toward the top of its ascending trendline resistance.
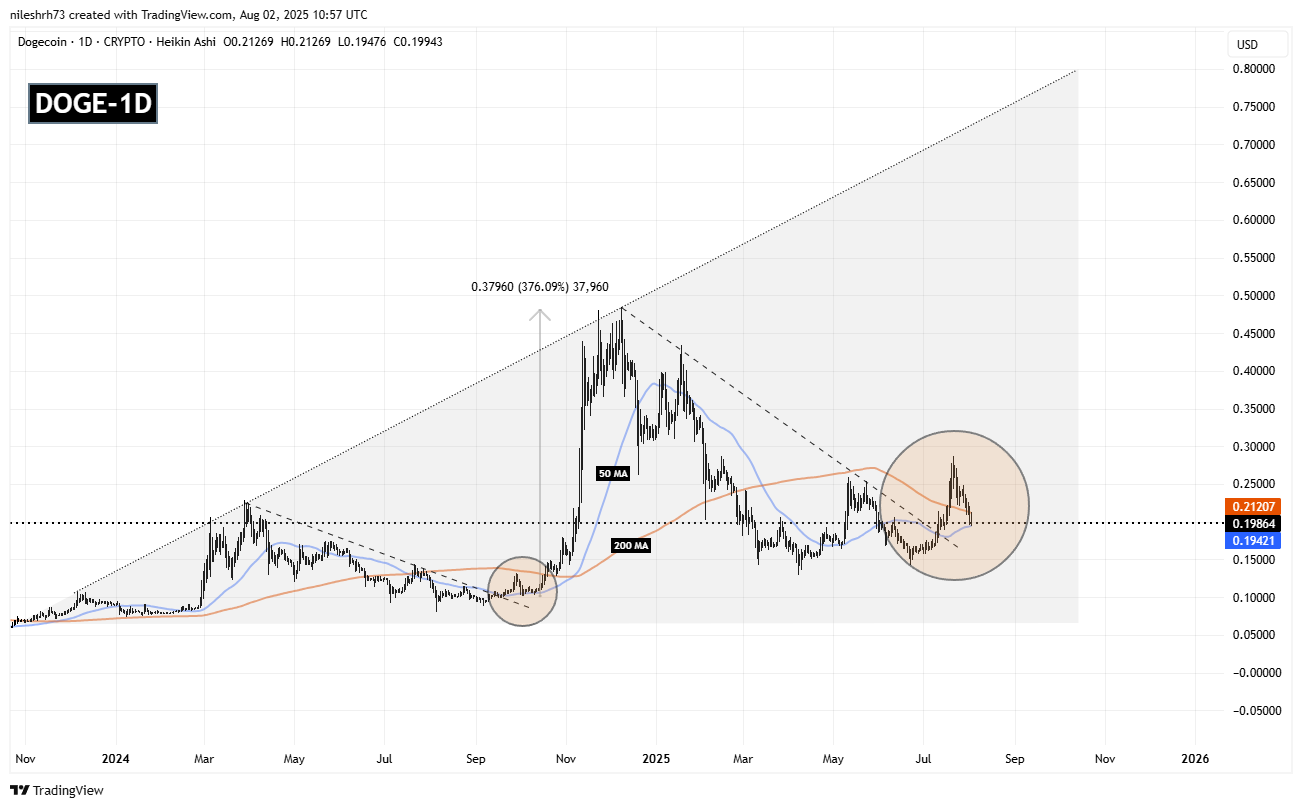 Dogecoin (DOGE) Fractal Chart/Coinsprobe (Source: Tradingview)
Fast forward to now — DOGE seems to be retracing that same footprint.
It has once again broken out of a downtrend and reclaimed its 50-day MA, followed by a pullback that is currently testing the same 50-day MA support — now around $0.1942. The technical similarity is striking, and if the pattern holds, history may be poised to repeat itself.
What’s Next for DOGE?
For the bullish case to stay alive, DOGE must defend the 50-day MA support. A successful bounce here could mirror the 2024 breakout sequence. The next key level to watch would be the 200-day MA, currently near $0.2120. Reclaiming this resistance could spark a renewed uptrend, possibly eyeing the ascending trendline resistance — which lies beyond the $0.80 level.
However, failure to hold the 50-day MA may invalidate the fractal setup and open the door for deeper correction.