
Bitcoin (BTC) Price Prediction for August 2

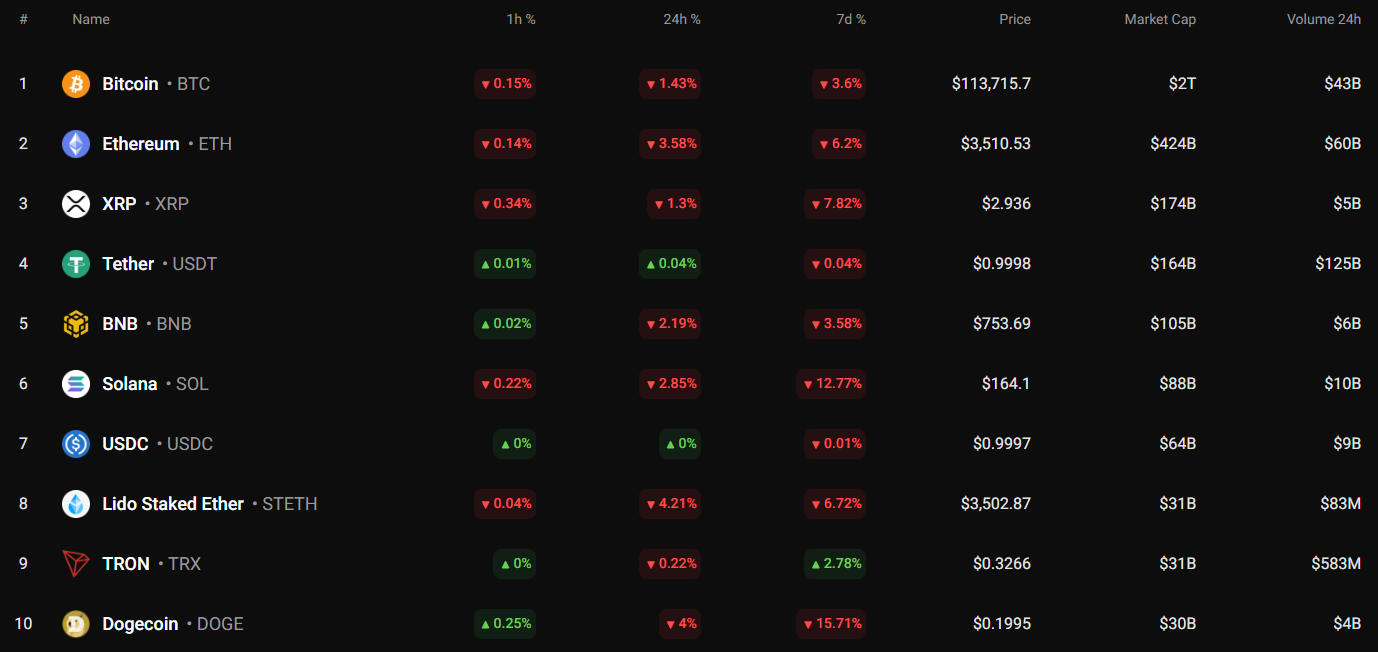
Saturday is mainly dominated by sellers, according to CoinStats.
BTC/USD
The price of Bitcoin (BTC) has declined by 1.43% over the last day.
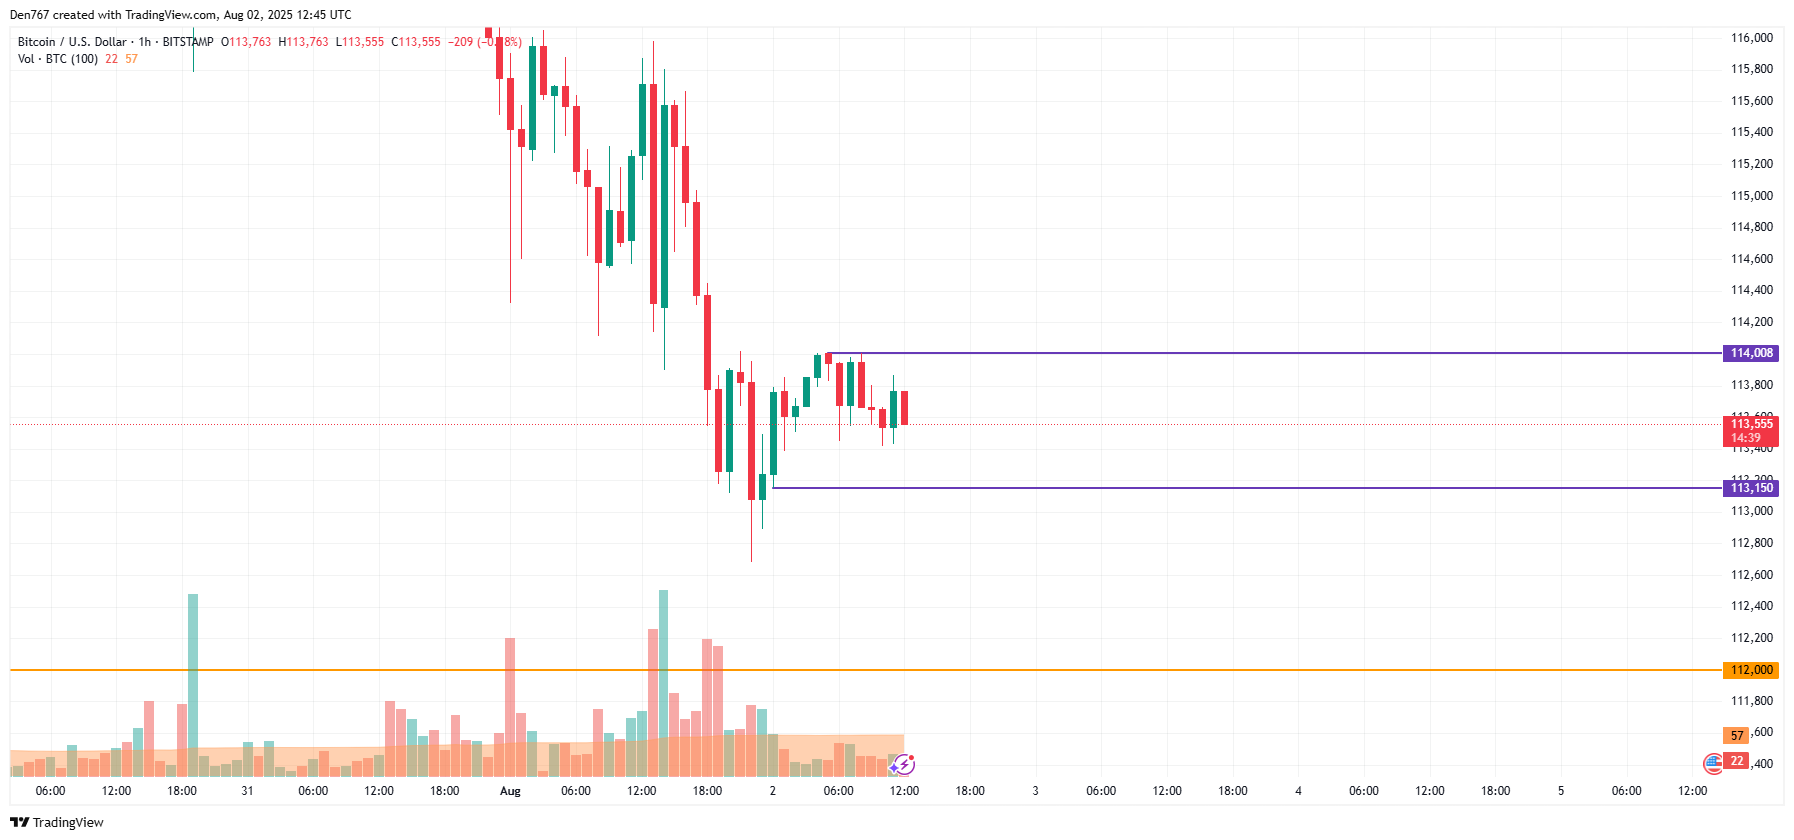
On the hourly chart, the rate of BTC is going down after a false breakout of the local resistance of $114,008. If the daily bar closes far from that mark, there is a high chance of a test of the support by the end of the day.
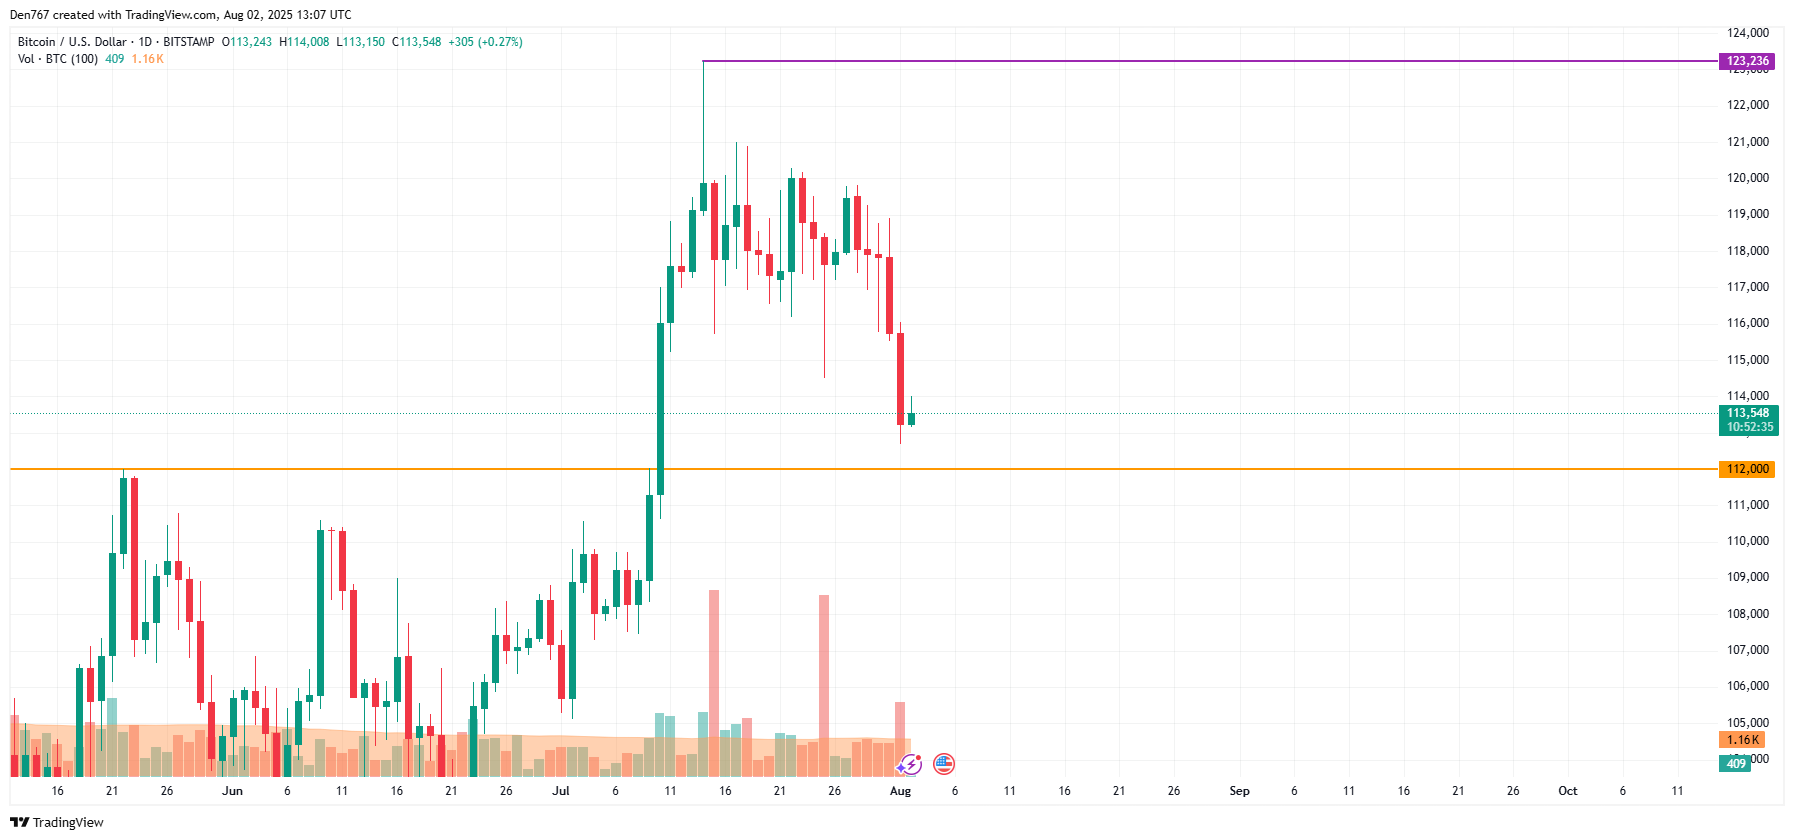
On the bigger time frame, the price of the main crypto is within yesterday's candle.
If the bar closes below $113,000, traders may witness a test of support over the next few days.
From the midterm point of view, the rate of BTC has almost touched the nearest level of $112,000. If its breakout happens, the accumulated energy might be enough for an ongoing correction to the $110,000 mark and below.
Bitcoin is trading at $113,489 at press time.
Disclaimer: The content of this article solely reflects the author's opinion and does not represent the platform in any capacity. This article is not intended to serve as a reference for making investment decisions.
You may also like
[Initial Listing] Bitget Will List Datagram (DGRAM) in the Innovation and DePIN Zone
Bitget Spot Margin Announcement on Suspension of L3/USDT, ULTI/USDT Margin Trading Services
Bitget PoolX is listing Planck (PLANCK): Lock BTC to get PLANCK airdrop
Bitget x PLANCK Carnival: Grab a share of 1,880,000 PLANCK!