Bitget App
Trade smarter
Buy cryptoMarketsTradeFuturesEarnSquareMore
INIT Surges 12.99% from Falling Wedge — Will It Hold Above the $0.436 Breakout Zone?

INIT Surges 12.99% from Falling Wedge — Will It Hold Above the $0.436 Breakout Zone?

CryptonewslandCryptonewsland2025/08/04 20:30
By:by Vee Peninah
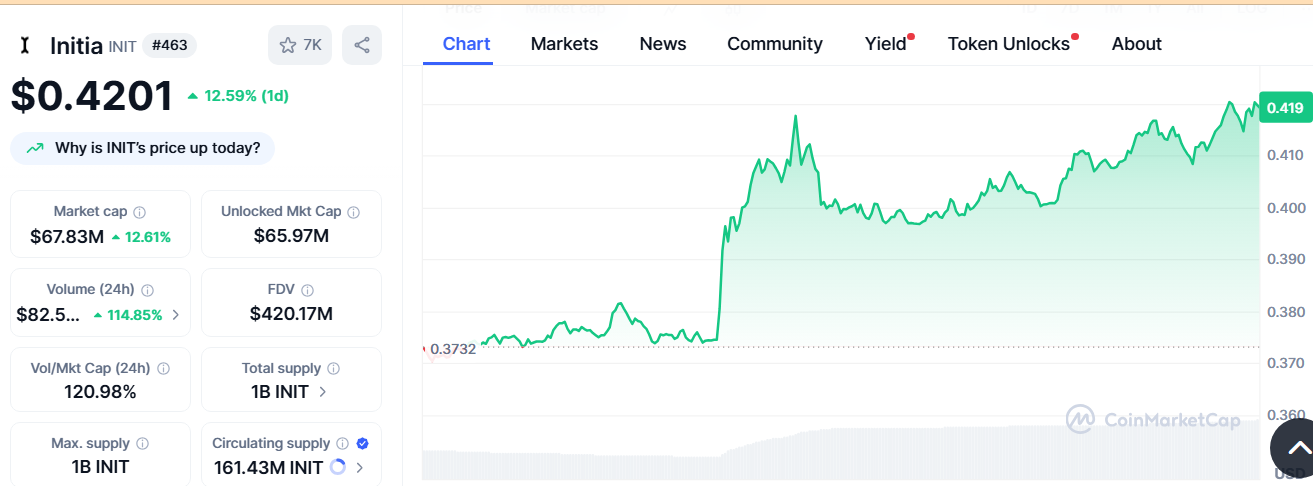
  • INIT trades at $0.4210 with a 12.99% daily gain, approaching the $0.436 resistance level.
  • The falling wedge pattern signals tightening price action and increased trading activity, backed by a 110.66% volume surge.
  • Market cap rose to $67.96 million, while circulating supply remains at 161.43 million INIT.

INIT has gained 12.99% in the past 24 hours, rising to $0.4210, according to data from CoinMarketCap. This movement comes as the token trades within a falling wedge pattern on the 12-hour chart. Traders are closely monitoring this structure because it often indicates a potential shift in market direction if a breakout occurs. Notably, volume has surged by 110.66% to $82.1 million, reinforcing the market’s heightened activity.

$INIT Falling Wedge Formation in 12H Timeframe✅

Incase of Breakout,Expecting Massive Bullish wave📈 #INIT #INITUSDT pic.twitter.com/GUvNWy2gfP

— ZAYK Charts (@ZAYKCharts) August 4, 2025

The current price is testing the $0.436 level, which remains a critical area for near-term price action. A decisive breakout above this point may bring $0.4825 into focus as the next resistance. The falling wedge pattern has developed over several weeks , with INIT consolidating between lower highs and lower lows.

This structure has narrowed recently, placing emphasis on the upper trendline. In addition, INIT has held support levels near $0.3840, which continues to act as a base for short-term price stability.

Market Metrics Highlight Strong Trading Activity in INIT

Alongside its price action, INIT’s market cap has increased by 12.85% to $67.96 million. The circulating supply currently stands at 161.43 million tokens out of a total supply of 1 billion. 

INIT Surges 12.99% from Falling Wedge — Will It Hold Above the $0.436 Breakout Zone? image 0 INIT Surges 12.99% from Falling Wedge — Will It Hold Above the $0.436 Breakout Zone? image 1 Source: CoinMarketCap

Furthermore, the token’s fully diluted valuation (FDV) has reached $420.46 million. These metrics, combined with the trading volume spike, highlight a period of notable activity. The relationship between volume and market cap now sits at 120.98%, signaling intensified trading participation.

Resistance Test and Volume Trends Shape INIT’s Next Move

Despite the recent gains, market focus remains on how INIT interacts with its resistance levels. The 12-hour chart indicates that a breakout from the wedge could potentially extend toward $0.8230, its recent high. However, this level depends on sustained momentum and whether price movement holds above short-term support. 

As trading sessions unfold, INIT’s position relative to the wedge’s trendlines will remain crucial for market participants analyzing its next steps. INIT’s price action remains centered on the falling wedge structure. Traders will closely track resistance levels and volume trends to determine whether the token sustains momentum or consolidates near current levels.

0
0

Disclaimer: The content of this article solely reflects the author's opinion and does not represent the platform in any capacity. This article is not intended to serve as a reference for making investment decisions.

PoolX: Earn new token airdrops
Lock your assets and earn 10%+ APR
Lock now!

You may also like

This Week's Preview: Macro "Flood Release" Week—Delayed CPI and the Bank of Japan's "Rate Hike Pursuit"

Key global market data will be released this week, including the U.S. non-farm payroll report, CPI inflation data, and the Bank of Japan's interest rate decision, all of which will significantly impact market liquidity. Bitcoin prices are fluctuating due to macroeconomic factors, while institutions such as Coinbase and HashKey are striving to break through via innovation and public listings. Summary generated by Mars AI This summary was generated by the Mars AI model. Its accuracy and completeness are still being iteratively improved.

MarsBit2025/12/15 05:05
This Week's Preview: Macro "Flood Release" Week—Delayed CPI and the Bank of Japan's "Rate Hike Pursuit"

Weekly Hot Picks: The Fed Cuts Rates and Indirectly "Injects Liquidity"! Silver Replaces Gold as the New Favorite?

The Federal Reserve is cutting interest rates and starting bond purchases, while Japan and other regions may turn to rate hikes. Silver repeatedly hits record highs, SpaceX is set for a 1.5 trillion IPO, and Oracle becomes the litmus test for the AI bubble. The Russia-Ukraine peace process is stuck on territorial issues, the US seizes a Venezuelan oil tanker... What exciting market events did you miss this week?

Jin102025/12/15 03:34
Weekly Hot Picks: The Fed Cuts Rates and Indirectly "Injects Liquidity"! Silver Replaces Gold as the New Favorite?

Key Highlights to Watch at Solana Breakpoint 2025

How does Solana seize market share in an increasingly competitive landscape?

Chaincatcher2025/12/15 03:33
Key Highlights to Watch at Solana Breakpoint 2025
© 2025 Bitget