Dogecoin has formed a Bullish Harami pattern above the $0.20 support level, signaling a potential early-stage reversal after a recent downtrend, supported by stable volume and renewed buying interest.
-
Dogecoin’s Bullish Harami pattern suggests weakening selling pressure and growing buyer momentum.
-
Price holds steady above $0.20 with consistent trading volume, indicating market confidence near recent lows.
-
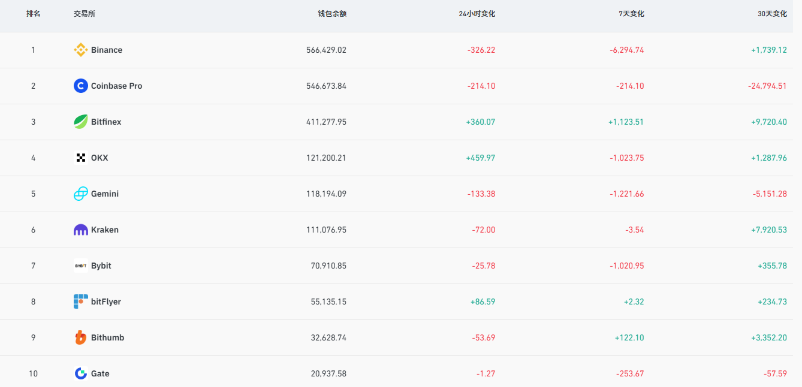
Over 818,000 DOGE tokens were added to portfolios as the market retests key support and flips trendlines.
Dogecoin forms Bullish Harami pattern above $0.20, signaling early reversal. Discover key market insights and volume trends in this detailed analysis.
Dogecoin Bullish Harami Pattern Emerges After Extended Downtrend
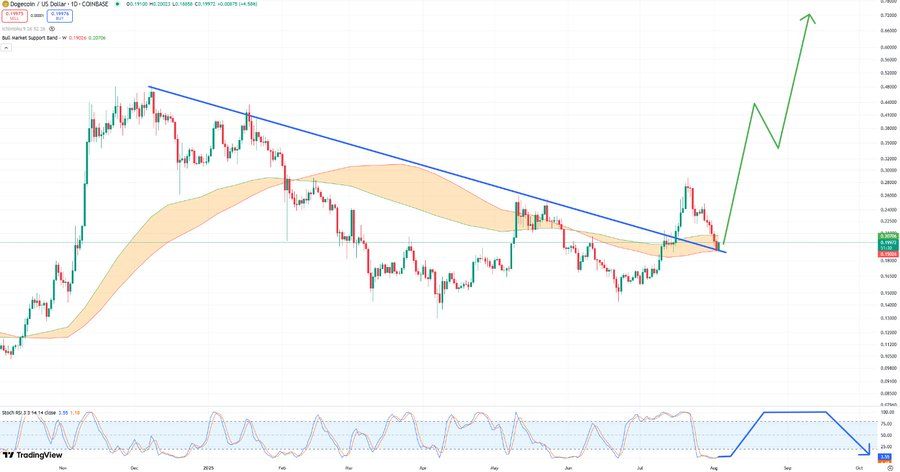
Dogecoin’s daily chart reveals a Bullish Harami pattern, a classic technical indicator signaling a potential trend reversal. This pattern appeared following a sustained downtrend from July 27 to August 2, characterized by a large bearish candle followed by a smaller bullish candle contained within the previous candle’s range. In cryptocurrency markets, continuous trading means the typical gap-up is not necessary for this pattern to hold significance.
How Does the Bullish Harami Pattern Indicate a Reversal?
The Bullish Harami pattern forms when a smaller green candle closes within the body of a preceding larger red candle, indicating that selling pressure is diminishing while buyers gain strength. On August 3, Dogecoin’s green candle closed higher than the previous day’s close, with price action ranging between $0.1959 and $0.2038 and a daily close at $0.2021, marking a 3.0% gain. This technical setup often precedes upward price movement, suggesting a shift in market sentiment.

Market Structure Remains Intact as Dogecoin Recovers Above Key Support
Dogecoin’s market capitalization stands at $30.38 billion, with a 24-hour trading volume of $1.43 billion and a circulating supply of 150.36 billion tokens, according to CoinGecko data. The price has maintained a solid foothold above the $0.20 support level, reflecting steady buying interest and market confidence. This stability is crucial for confirming the Bullish Harami pattern’s potential as a reversal signal.
What Does Recent Market Activity Suggest About Dogecoin’s Future?
Market analyst Chris observed that Dogecoin recently retested its bull market support band and successfully flipped the downtrend line into support. He commented, “This might have just been the ultimate shakeout before the real fun up.” Additionally, investors have accumulated over 818,000 DOGE tokens, reinforcing the notion of renewed demand. While further price confirmation is needed, these developments support a cautiously optimistic outlook.
$Doge/D1 #Dogecoin’s daily candle closed with a Bullish Harami Pattern variation. This pattern is characteristic and occurs at the bottom of a downtrend, featuring a larger bearish green candle on Day 1 followed by a smaller bullish candle on Day 2. In the continuous crypto… pic.twitter.com/Mlf3ywBcaG
— Trader Tardigrade (@TATrader_Alan) August 4, 2025
 Source: Chris(X)
Frequently Asked Questions
What does the Bullish Harami pattern mean for Dogecoin’s price trend?
The Bullish Harami pattern indicates a potential early reversal in Dogecoin’s price after a downtrend, signaling that selling pressure is easing and buyers may be gaining control.
Why is holding the $0.20 support level important for Dogecoin?
Maintaining the $0.20 support level demonstrates market strength and buyer confidence, which is essential for confirming a positive shift in Dogecoin’s price momentum.
Key Takeaways
- Bullish Harami pattern: Signals a potential early-stage reversal after a downtrend in Dogecoin’s price.
- Support level: Price holding above $0.20 indicates renewed buying interest and market confidence.
- Market activity: Over 818,000 DOGE added to portfolios as trendlines flip and support retests occur.
Conclusion
Dogecoin’s formation of a Bullish Harami pattern above the $0.20 support level marks a significant technical development, suggesting a potential early reversal in its recent downtrend. Stable volume and increased accumulation reinforce this outlook. Market participants should monitor price continuation for confirmation, as this pattern may signal the start of renewed upward momentum in Dogecoin’s market trajectory.