Solana Price Recovery Hinges on 3 Key Metrics; One Could Even Trigger a Short-Term Rally

Solana’s sharp correction may look grim on the surface, but a drop in spot exchange supply, steady CME futures positioning, and a looming golden crossover tell a different story. If SOL holds above $160 and breaks through $176, a short-term recovery may be closer than most think.
Solana’s dream run toward $200 just a few weeks ago now feels like a distant memory. After shedding nearly 10% in the last seven days, the Solana price has come under pressure, but not all hope is lost.
Despite the decline, Solana is still up 10% over the past three months, and a trio of key market signals are now hinting that a recovery could be in the works. One of them, a rare chart-based formation, could even trigger a short-term rally if it plays out.
Exchange Selling Pressure Drops 10%, Signaling Less Dump Risk
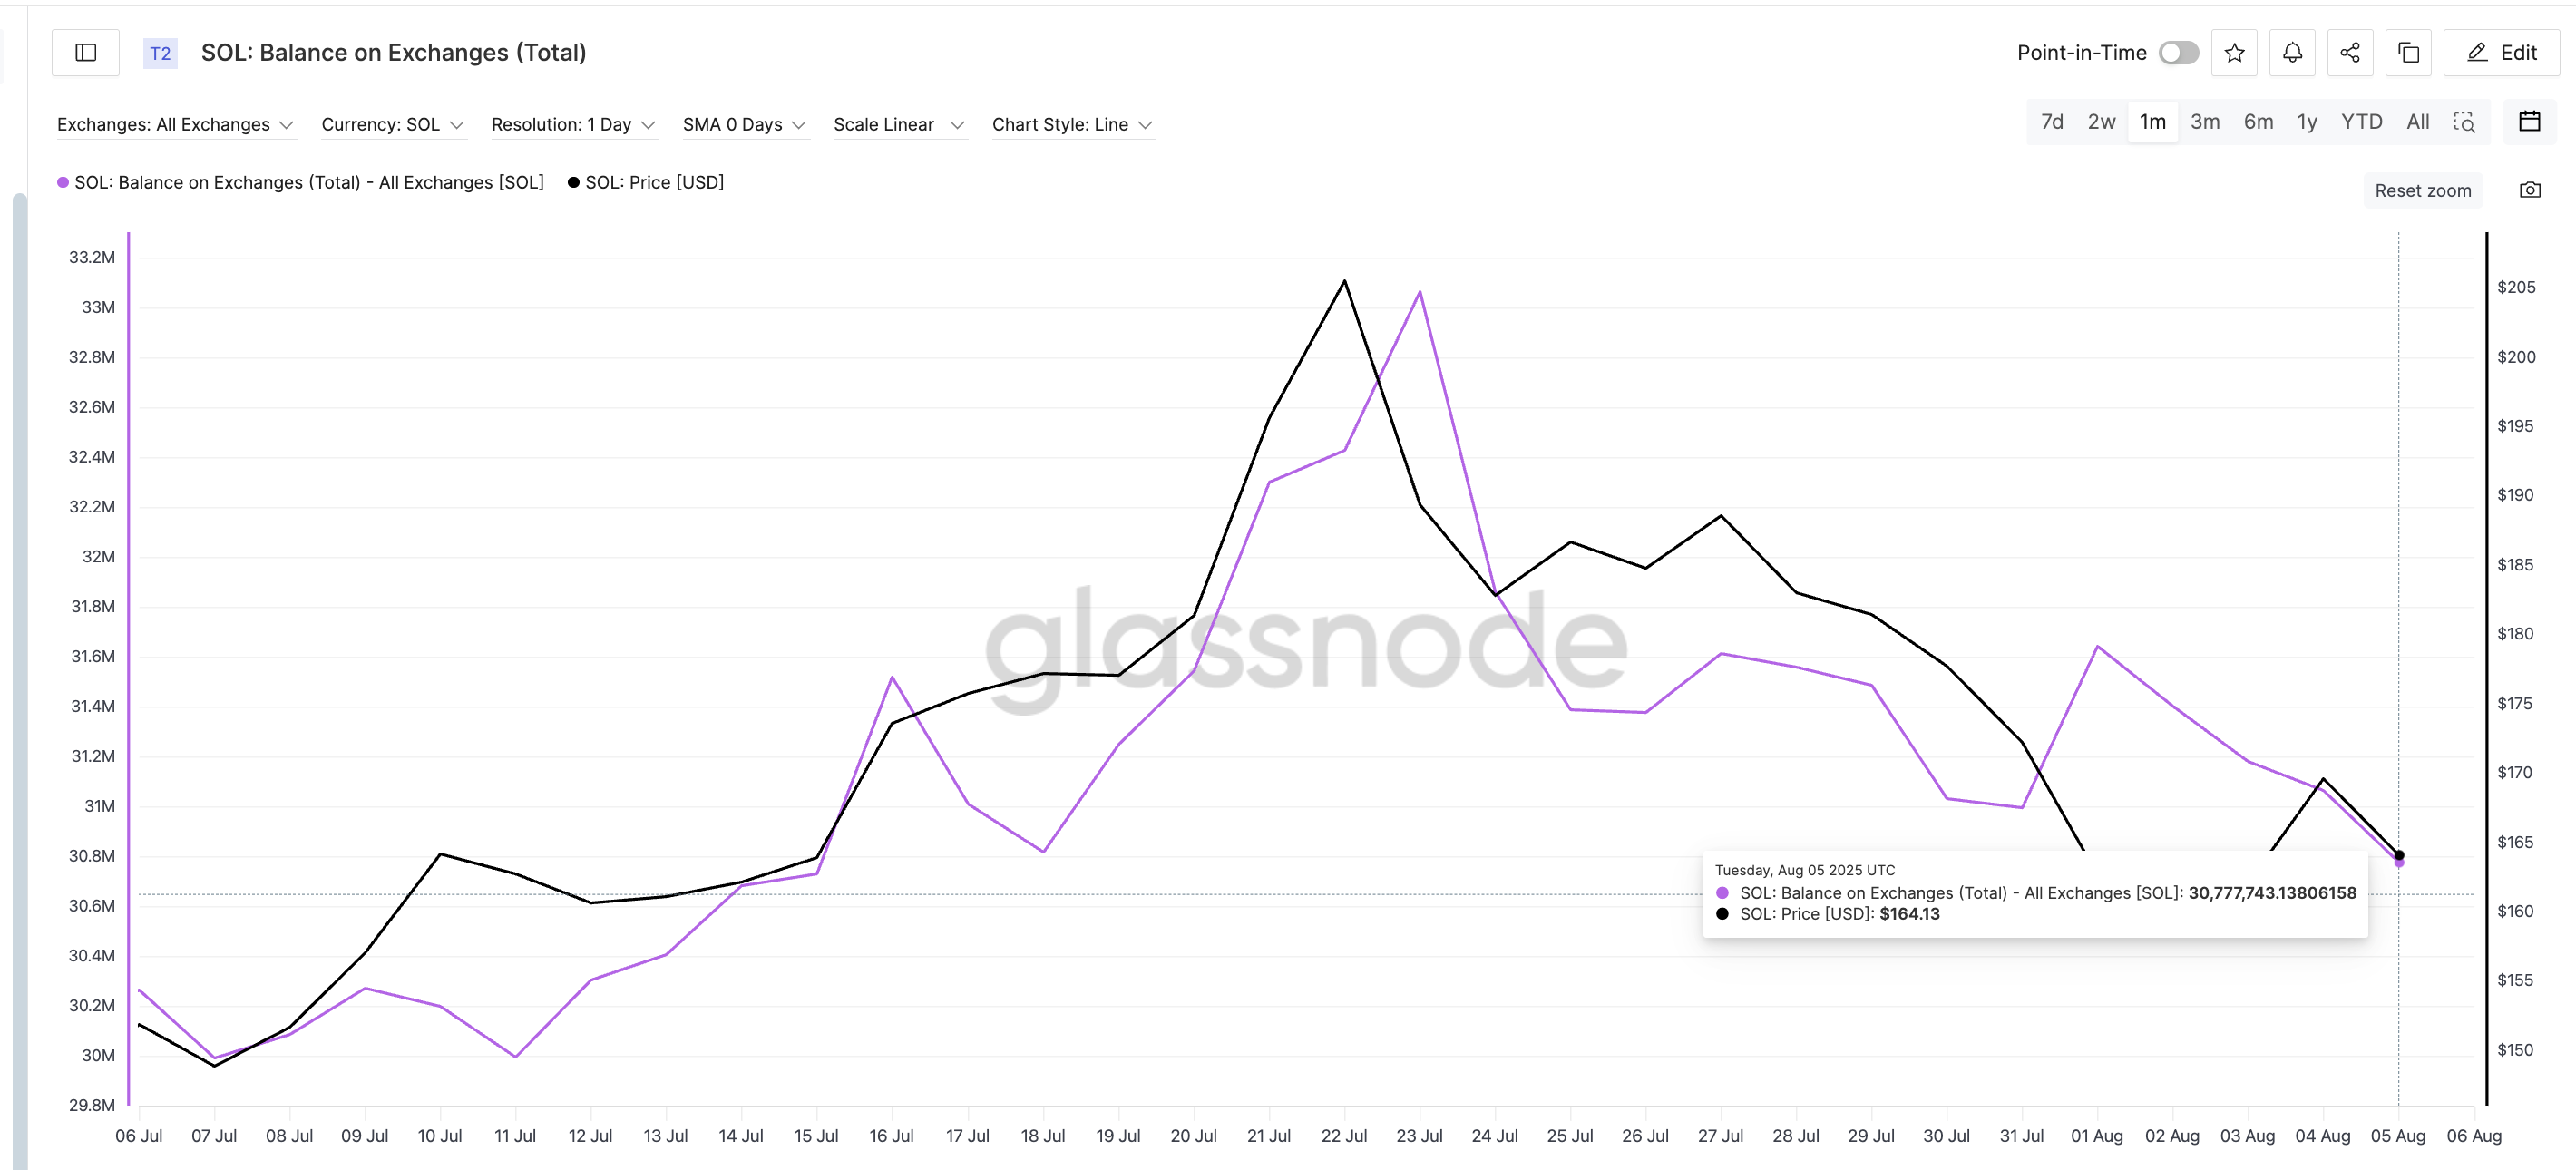
The first key shift comes from Solana’s balance on exchanges, which has dropped sharply from 33.06 million on July 23 to 30.78 million SOL on August 5; a fall of nearly 10%. This means fewer tokens are sitting on centralized exchanges, a classic sign of reduced selling pressure.
 Solana price and dipping exchange balances:
Glassnode
Solana price and dipping exchange balances:
Glassnode
More importantly, a bullish crossover has occurred on the same chart: Solana’s price has once again moved above the exchange supply trendline.
Historically, when this happens, short-term rallies often follow. For instance, on July 16, when Solana’s price crossed above this supply line, SOL jumped from $173 to $205 in six days. A similar move happened on July 24, where the price rose from $182 to $188 in just three sessions. The same crossover occurred at $169, and although the price has since corrected, the pattern remains worth watching.
Institutional Futures Hold Steady While Price Slides
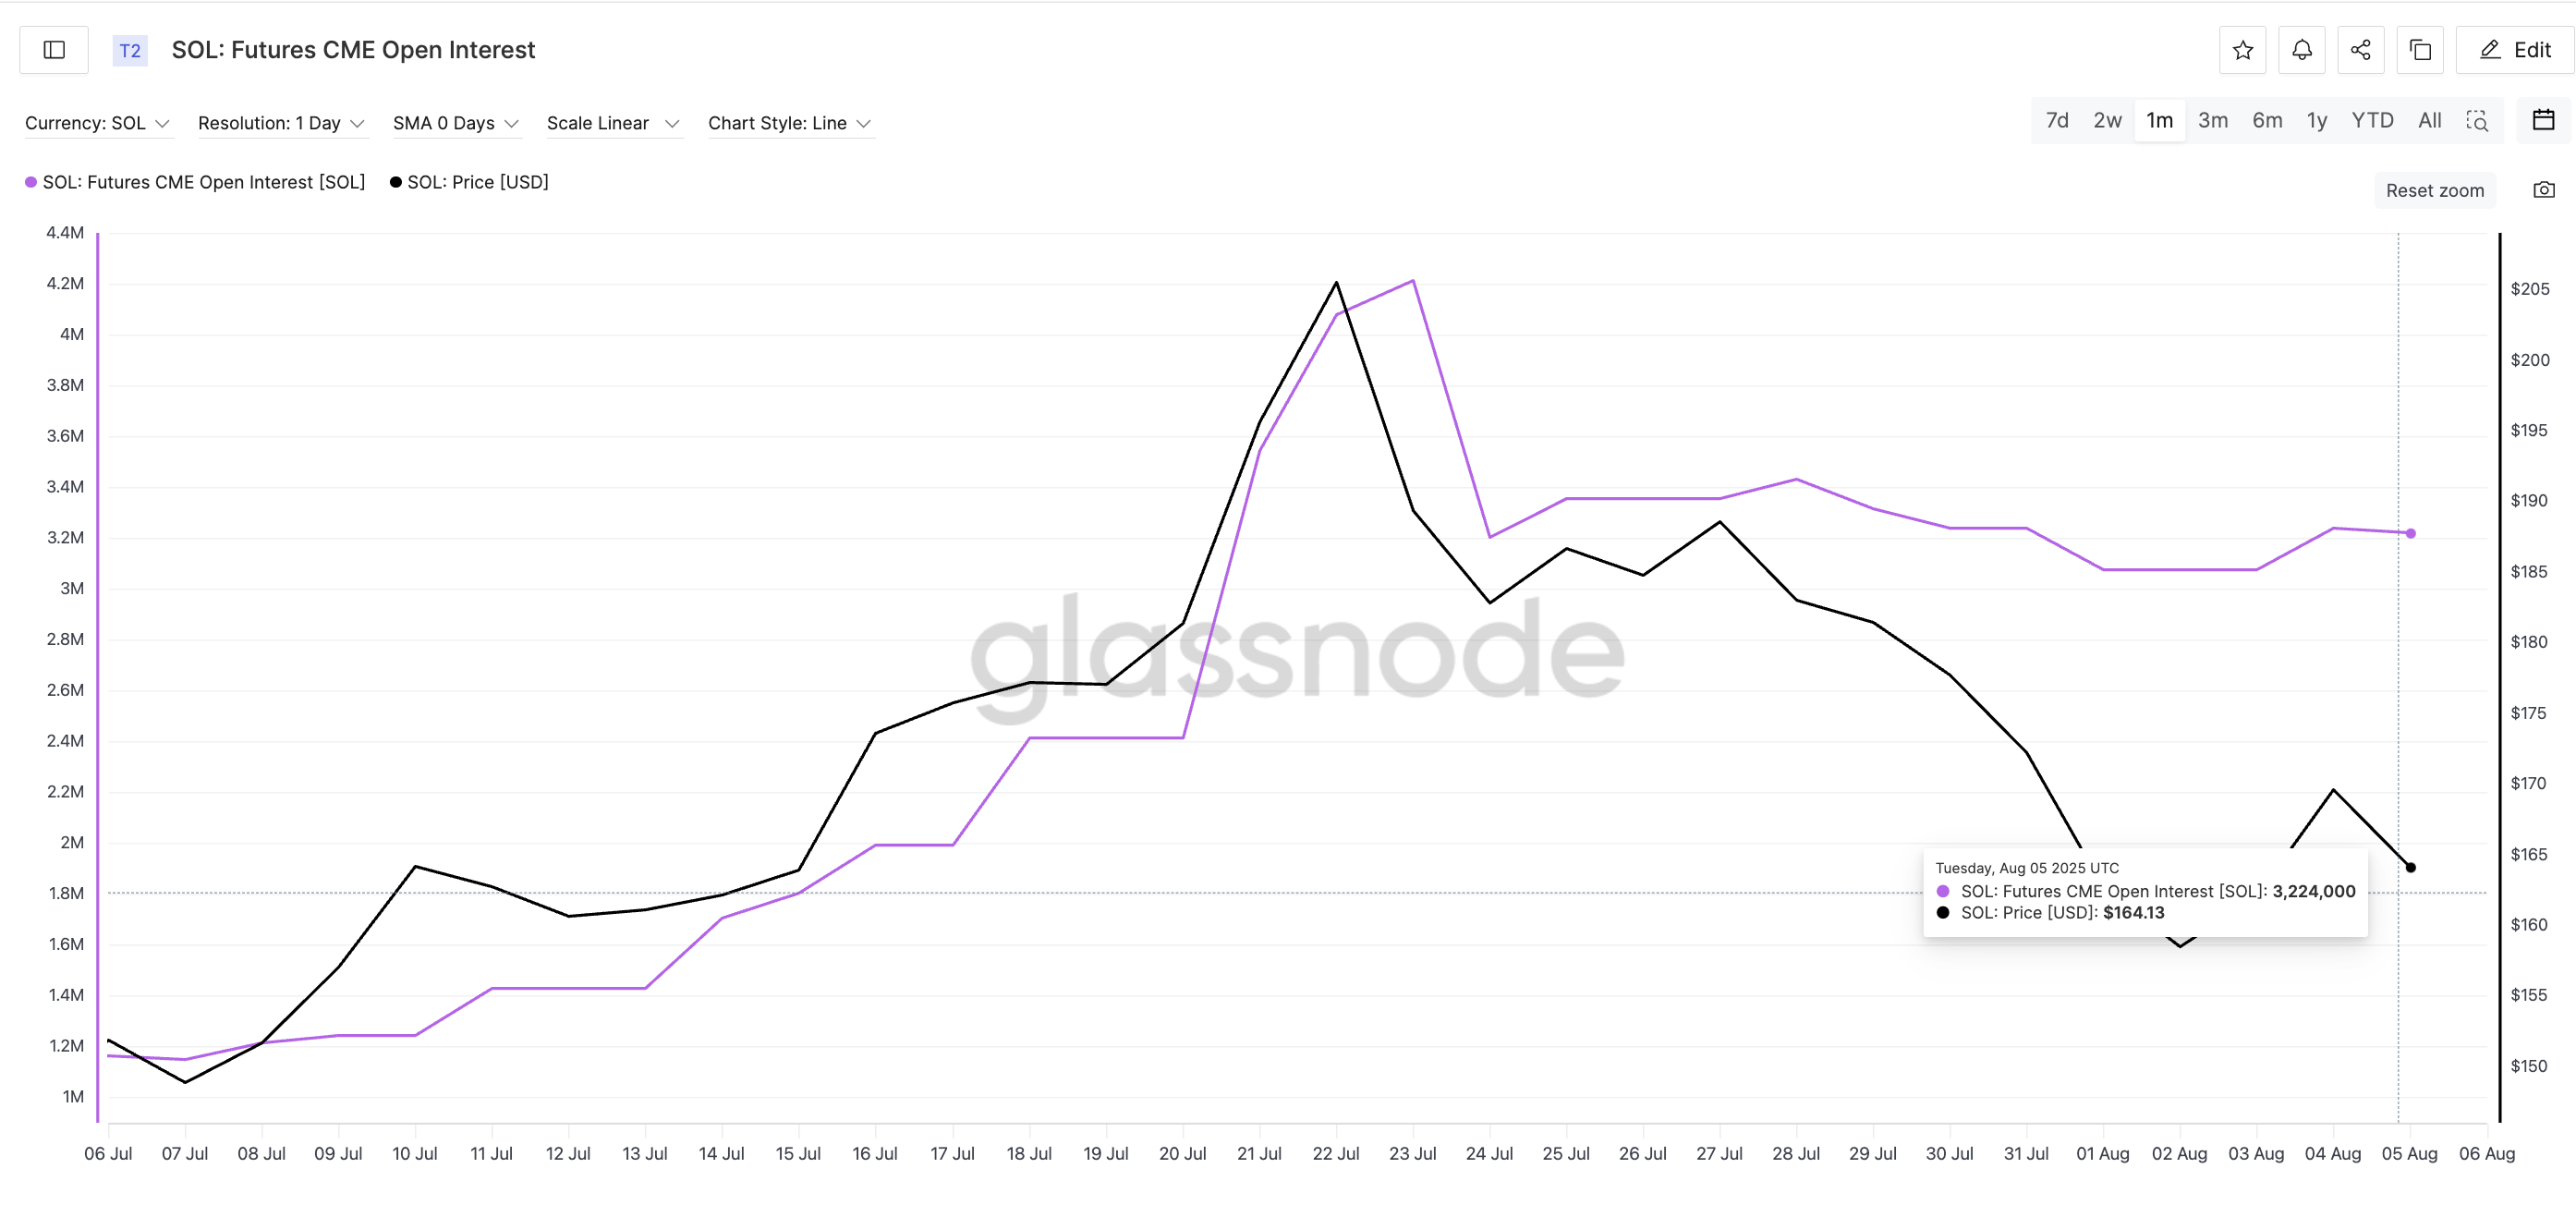
The second signal of strength comes from institutional derivatives. Solana’s CME (Chicago Mercantile Exchange) futures open interest has remained steady despite the spot price falling, forming a bullish divergence of sorts.
For example, on August 1, CME open interest held at 3.07 million while SOL’s price fell from $162 to $158; but then it quickly bounced back to $169 once that divergence narrowed.
 Solana price and CME Futures:
Glassnode
Solana price and CME Futures:
Glassnode
This isn’t the first time we’ve seen this play out. A similar pattern happened between July 25 and 27, when CME open interest remained flat and price dropped, only for Solana to bounce from $184 to $188 once sentiment stabilized.
Why does CME matter? Because it’s where institutional players trade. A steady futures open interest while the price declines often hints that long-term buyers are holding their ground, waiting for weaker hands to exit before jumping in again.
For token TA and market updates: Want more token insights like this? Sign up for Editor Harsh Notariya’s Daily Crypto Newsletter here.
Solana Price Daily Chart Flashes Potential Golden Crossover Setup
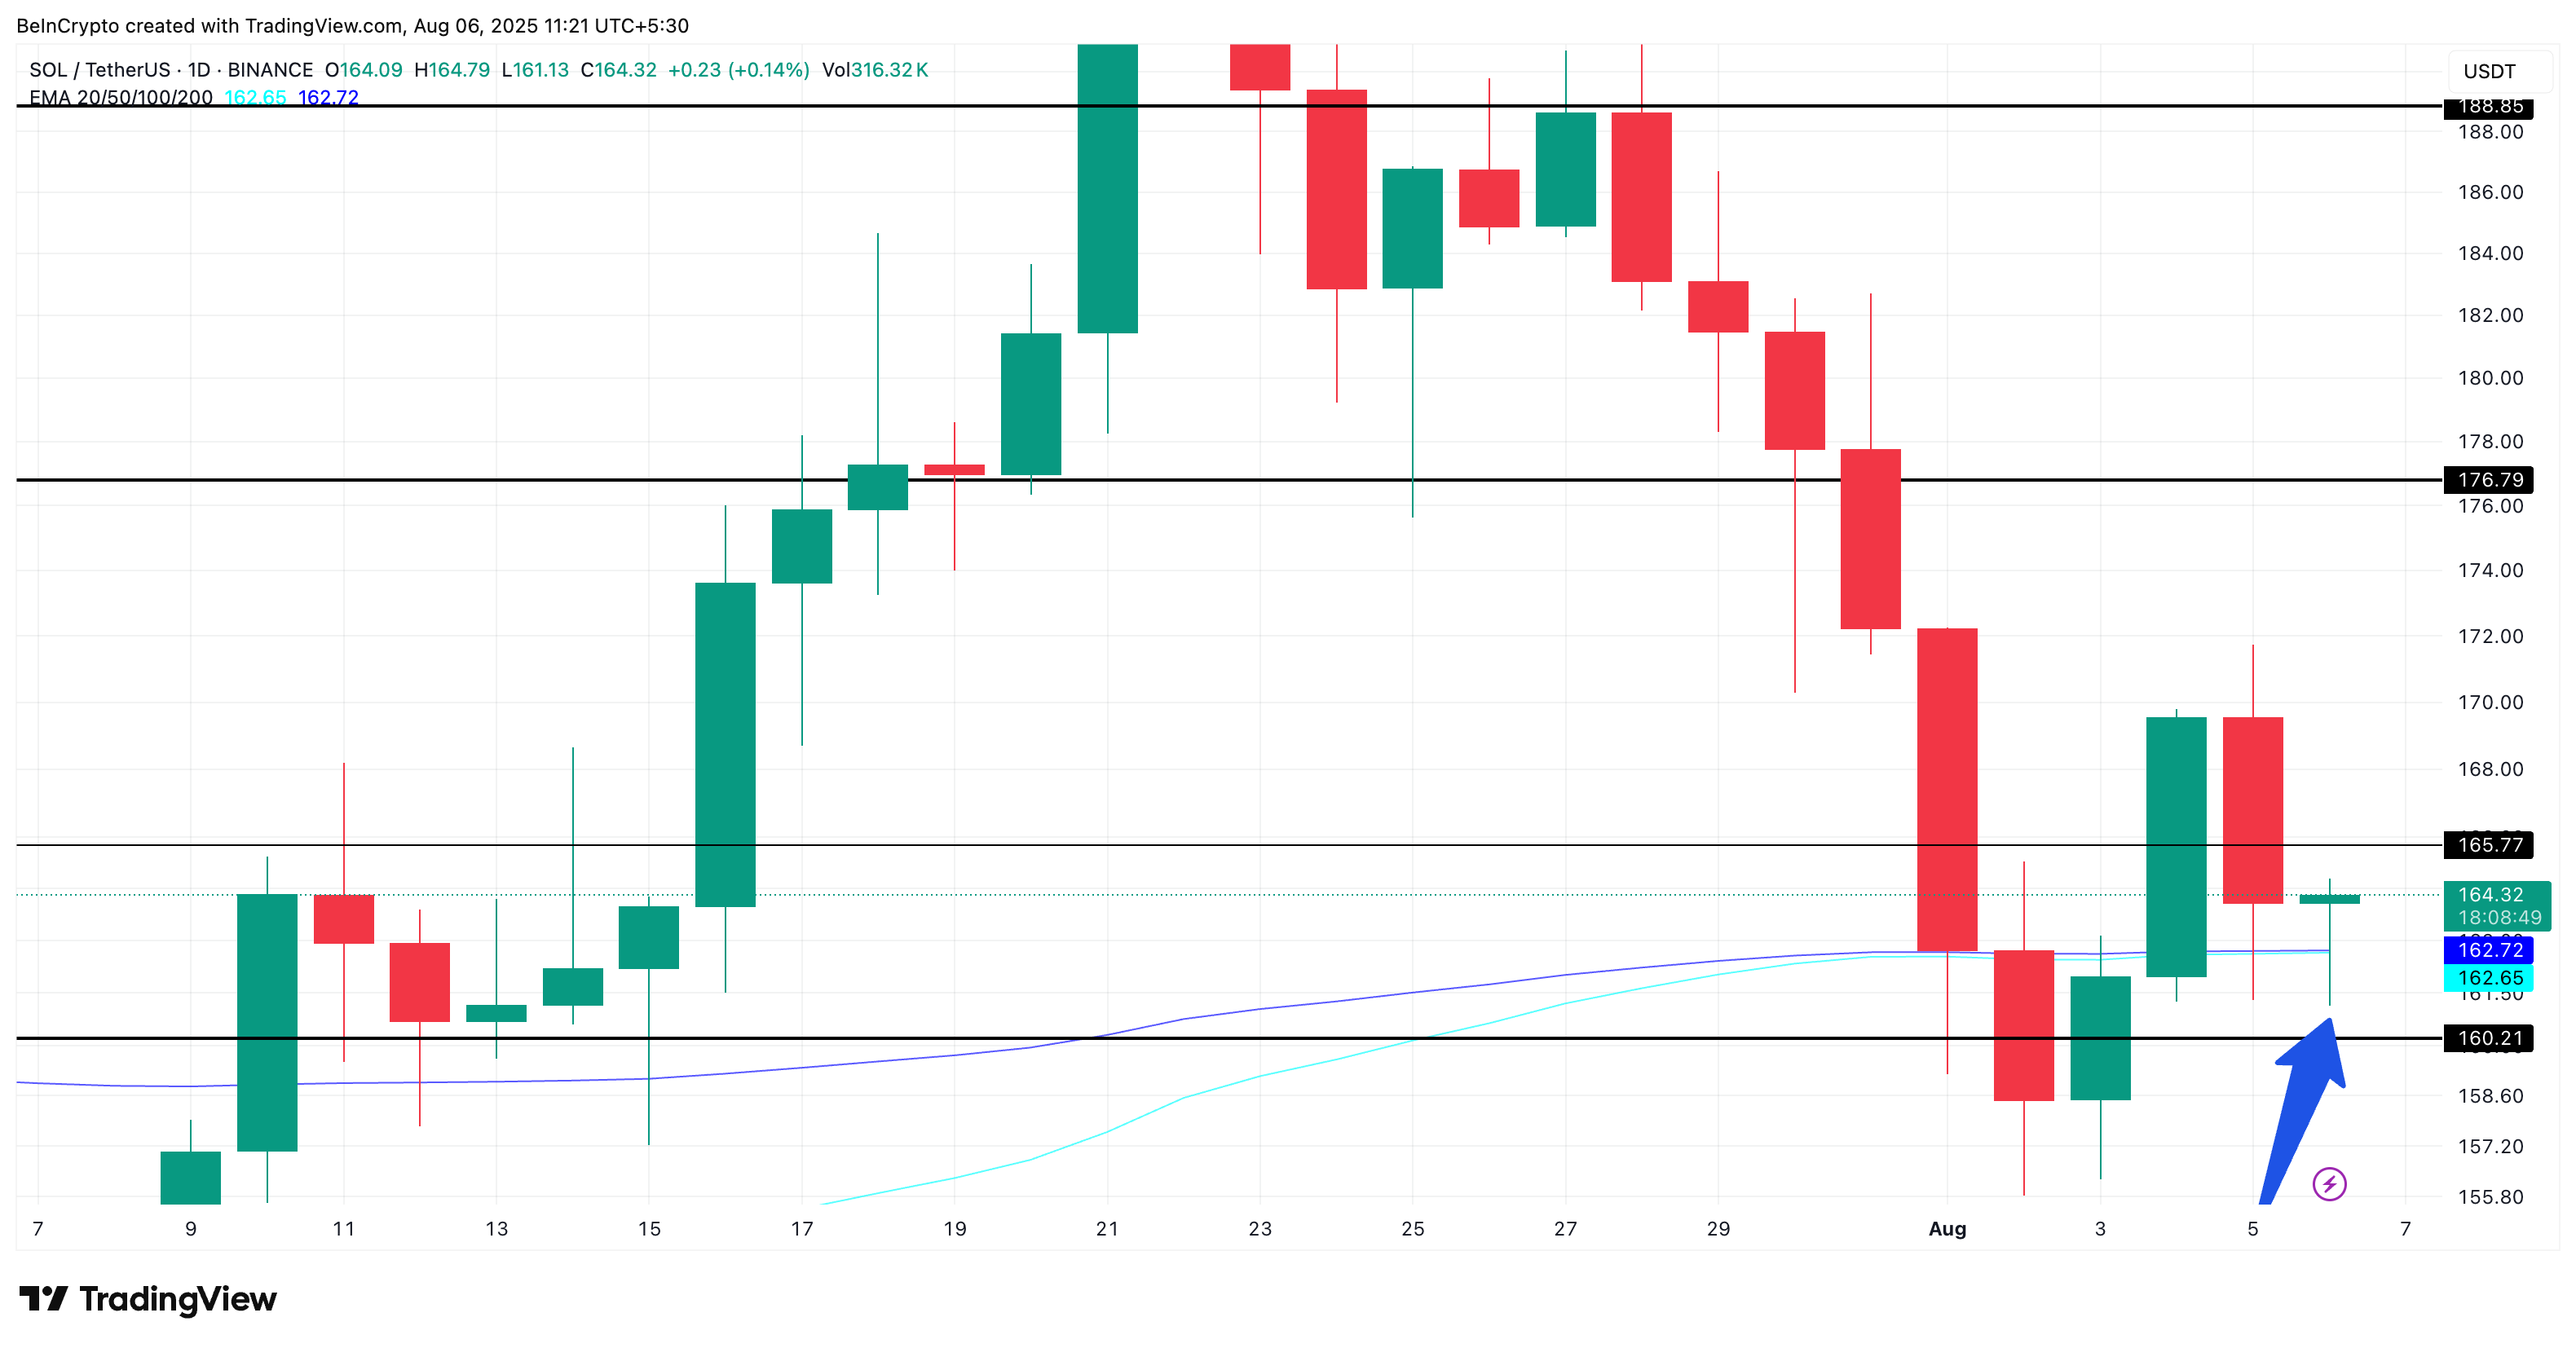
Finally, the most trader-focused signal is happening on the daily Solana price chart. The 100-day Exponential Moving Average (EMA) or the sky blue line is inching closer to crossing above the 200-day EMA (deep blue line); a setup commonly known as a golden crossover. If confirmed, this pattern usually signals the start of a stronger upward trend.
Even a rally at times!
 Solana price chart and a looming golden cross:
TradingView
Solana price chart and a looming golden cross:
TradingView
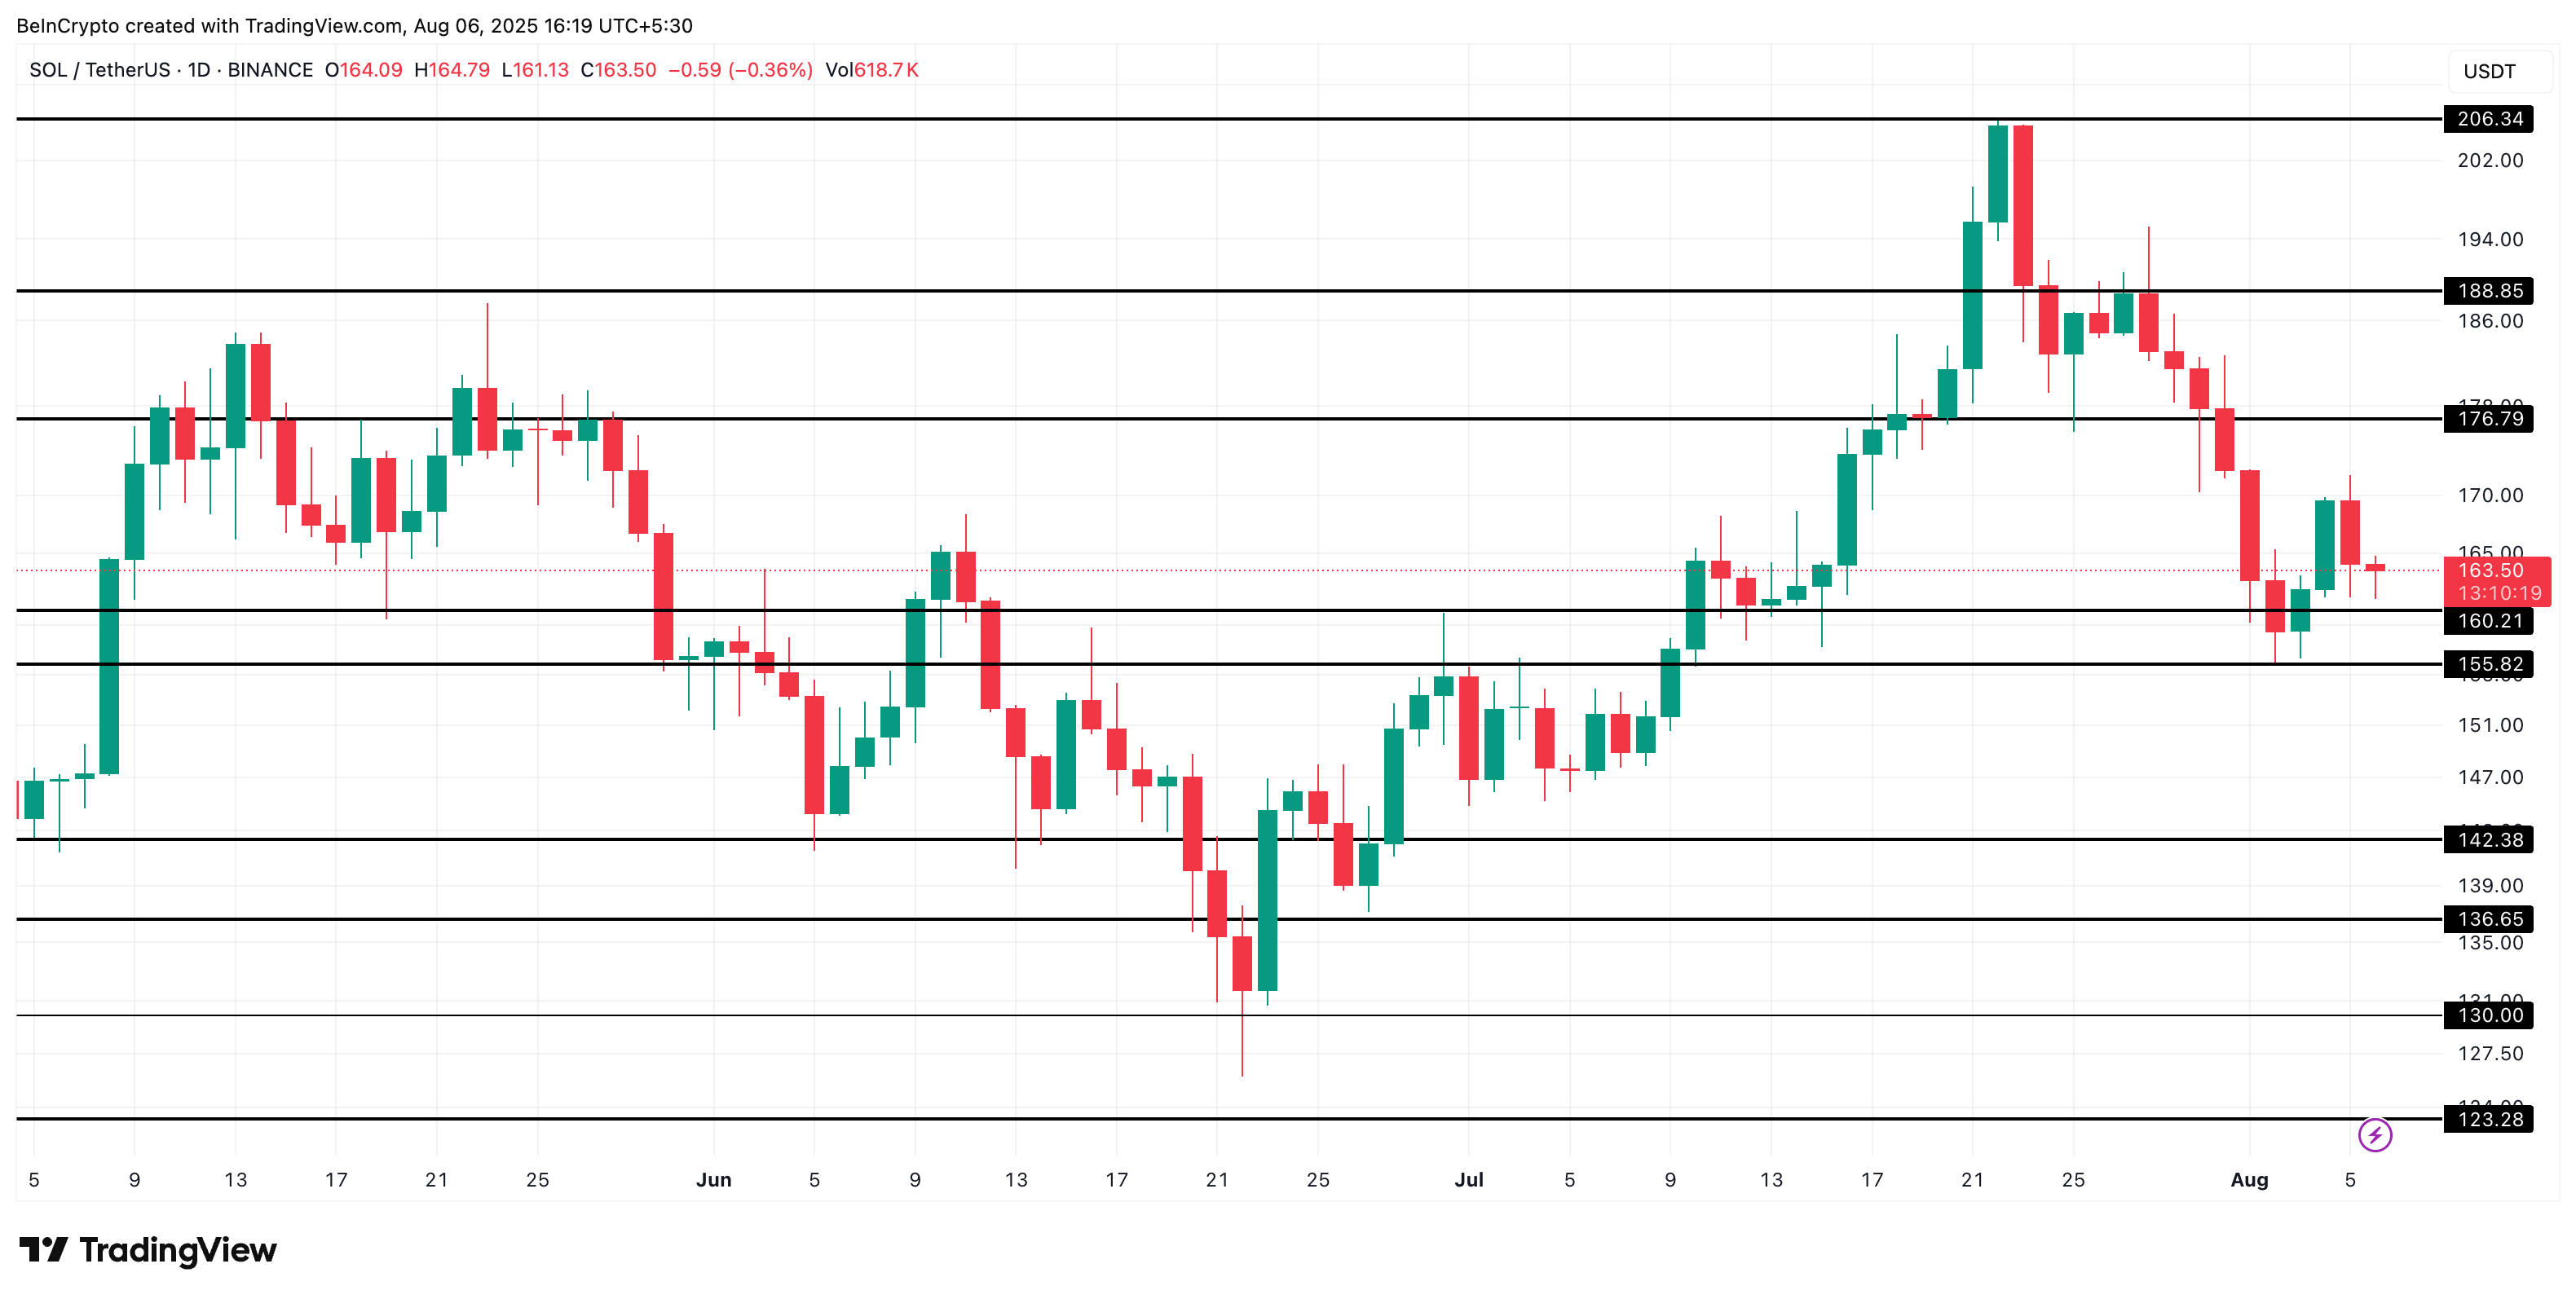
Currently, SOL is hovering above the $160 support. If that level holds and Solana manages to reclaim $176 (a 10% push from current levels), the short-term trend could flip bullish.
 Solana price analysis:
TradingView
Solana price analysis:
TradingView
A move beyond $188 would put $200 back on the table, while a break below $155 would risk further downside. The full invalidation comes only if SOL drops under $142. That might happen if the two EMA lines, closing in on each other, flip the other way. That means instead of the golden cross, a bearish or “Death crossover” happens with the 200-day EMA line crosses above the 100-day line.
Disclaimer: The content of this article solely reflects the author's opinion and does not represent the platform in any capacity. This article is not intended to serve as a reference for making investment decisions.
You may also like
Espresso co-founder’s decade in crypto: I wanted to disrupt Wall Street’s flaws, but witnessed a transformation into a casino instead
Everything you've been hoping for may have already arrived; it just looks different from what you expected.

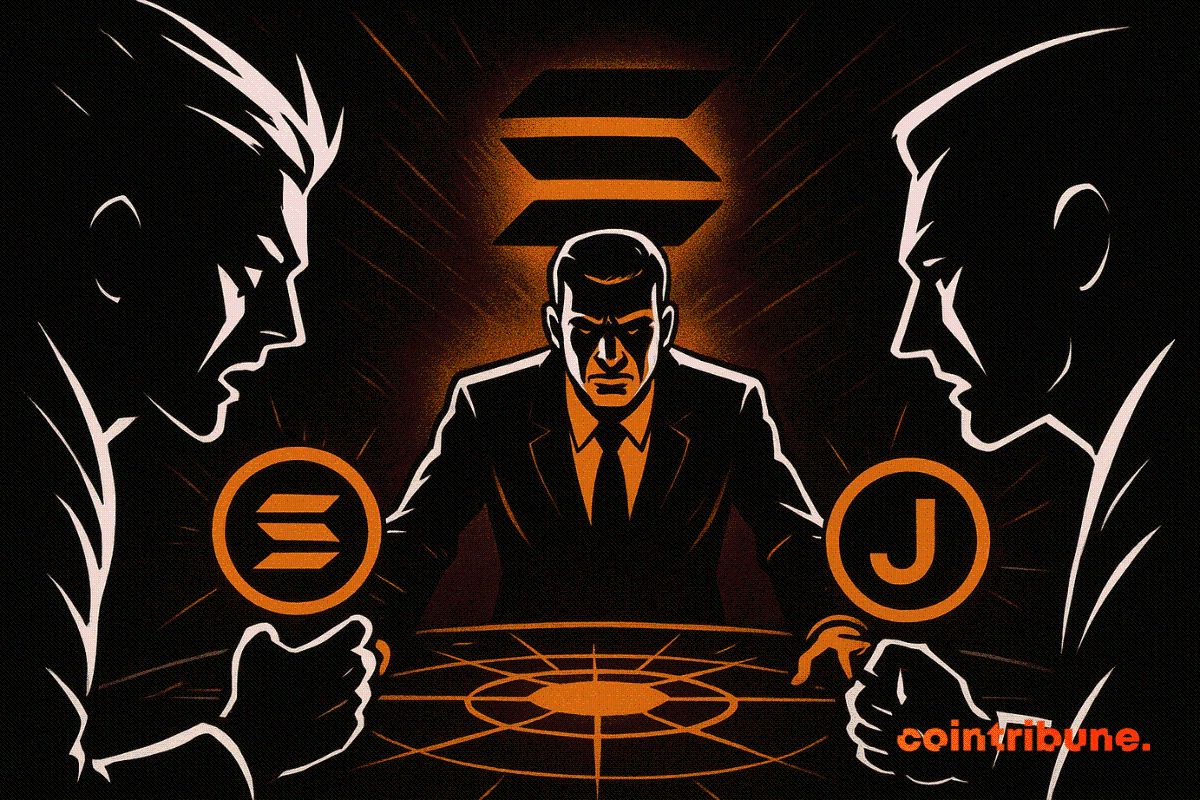
Solana Foundation Steps In as Kamino and Jupiter Lend Dispute Intensifies
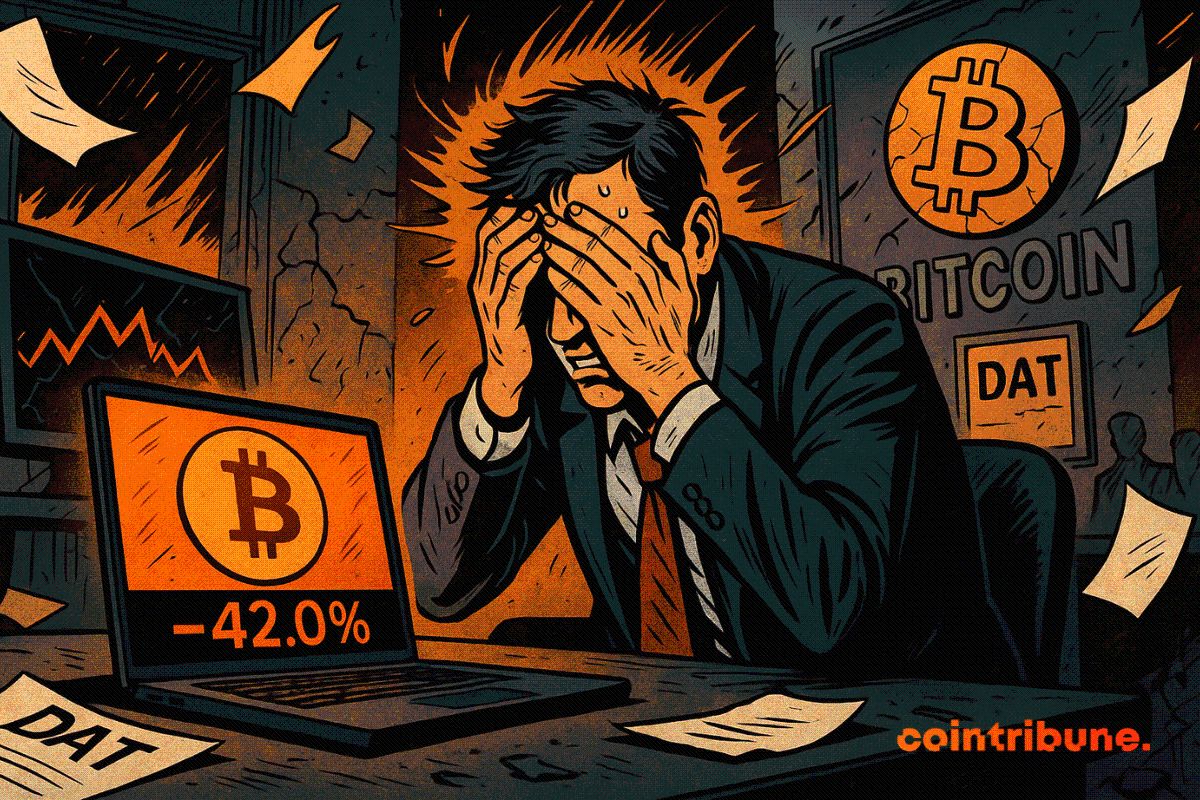
Bitcoin Firms Confront the Boomerang Effect of Excessive Leverage
Ethereum Burns $18B, Yet Its Supply Keeps Growing