Ethereum (ETH) is currently leading in capital inflows and futures market dominance, with a potential retest of the $4,000 level on the horizon.
-
Capital rotation favors Ether as the “Hot Capital Ratio” for Solana hits a yearly low.
-
ETH futures dominance grows with open interest reaching $58 billion.
-
ETH eyes the $4,000 mark, supported by low funding rates and robust spot accumulation.
Ether is leading the crypto market in capital inflows and futures dominance, with a potential $4,000 retest on the horizon. Read more for insights.
Capital flows favor Ethereum over Solana
Ether (ETH) has emerged as the primary beneficiary of capital rotation within the altcoin market.
According to Glassnode, the SOL/ETH Hot Capital Ratio, a measure of short-term realized capital movement, has declined to a year-to-date low of 0.045, marking a 42% drop since April.
This suggests that while ETH and SOL saw inflows in July, capital flow is now favoring Ether.
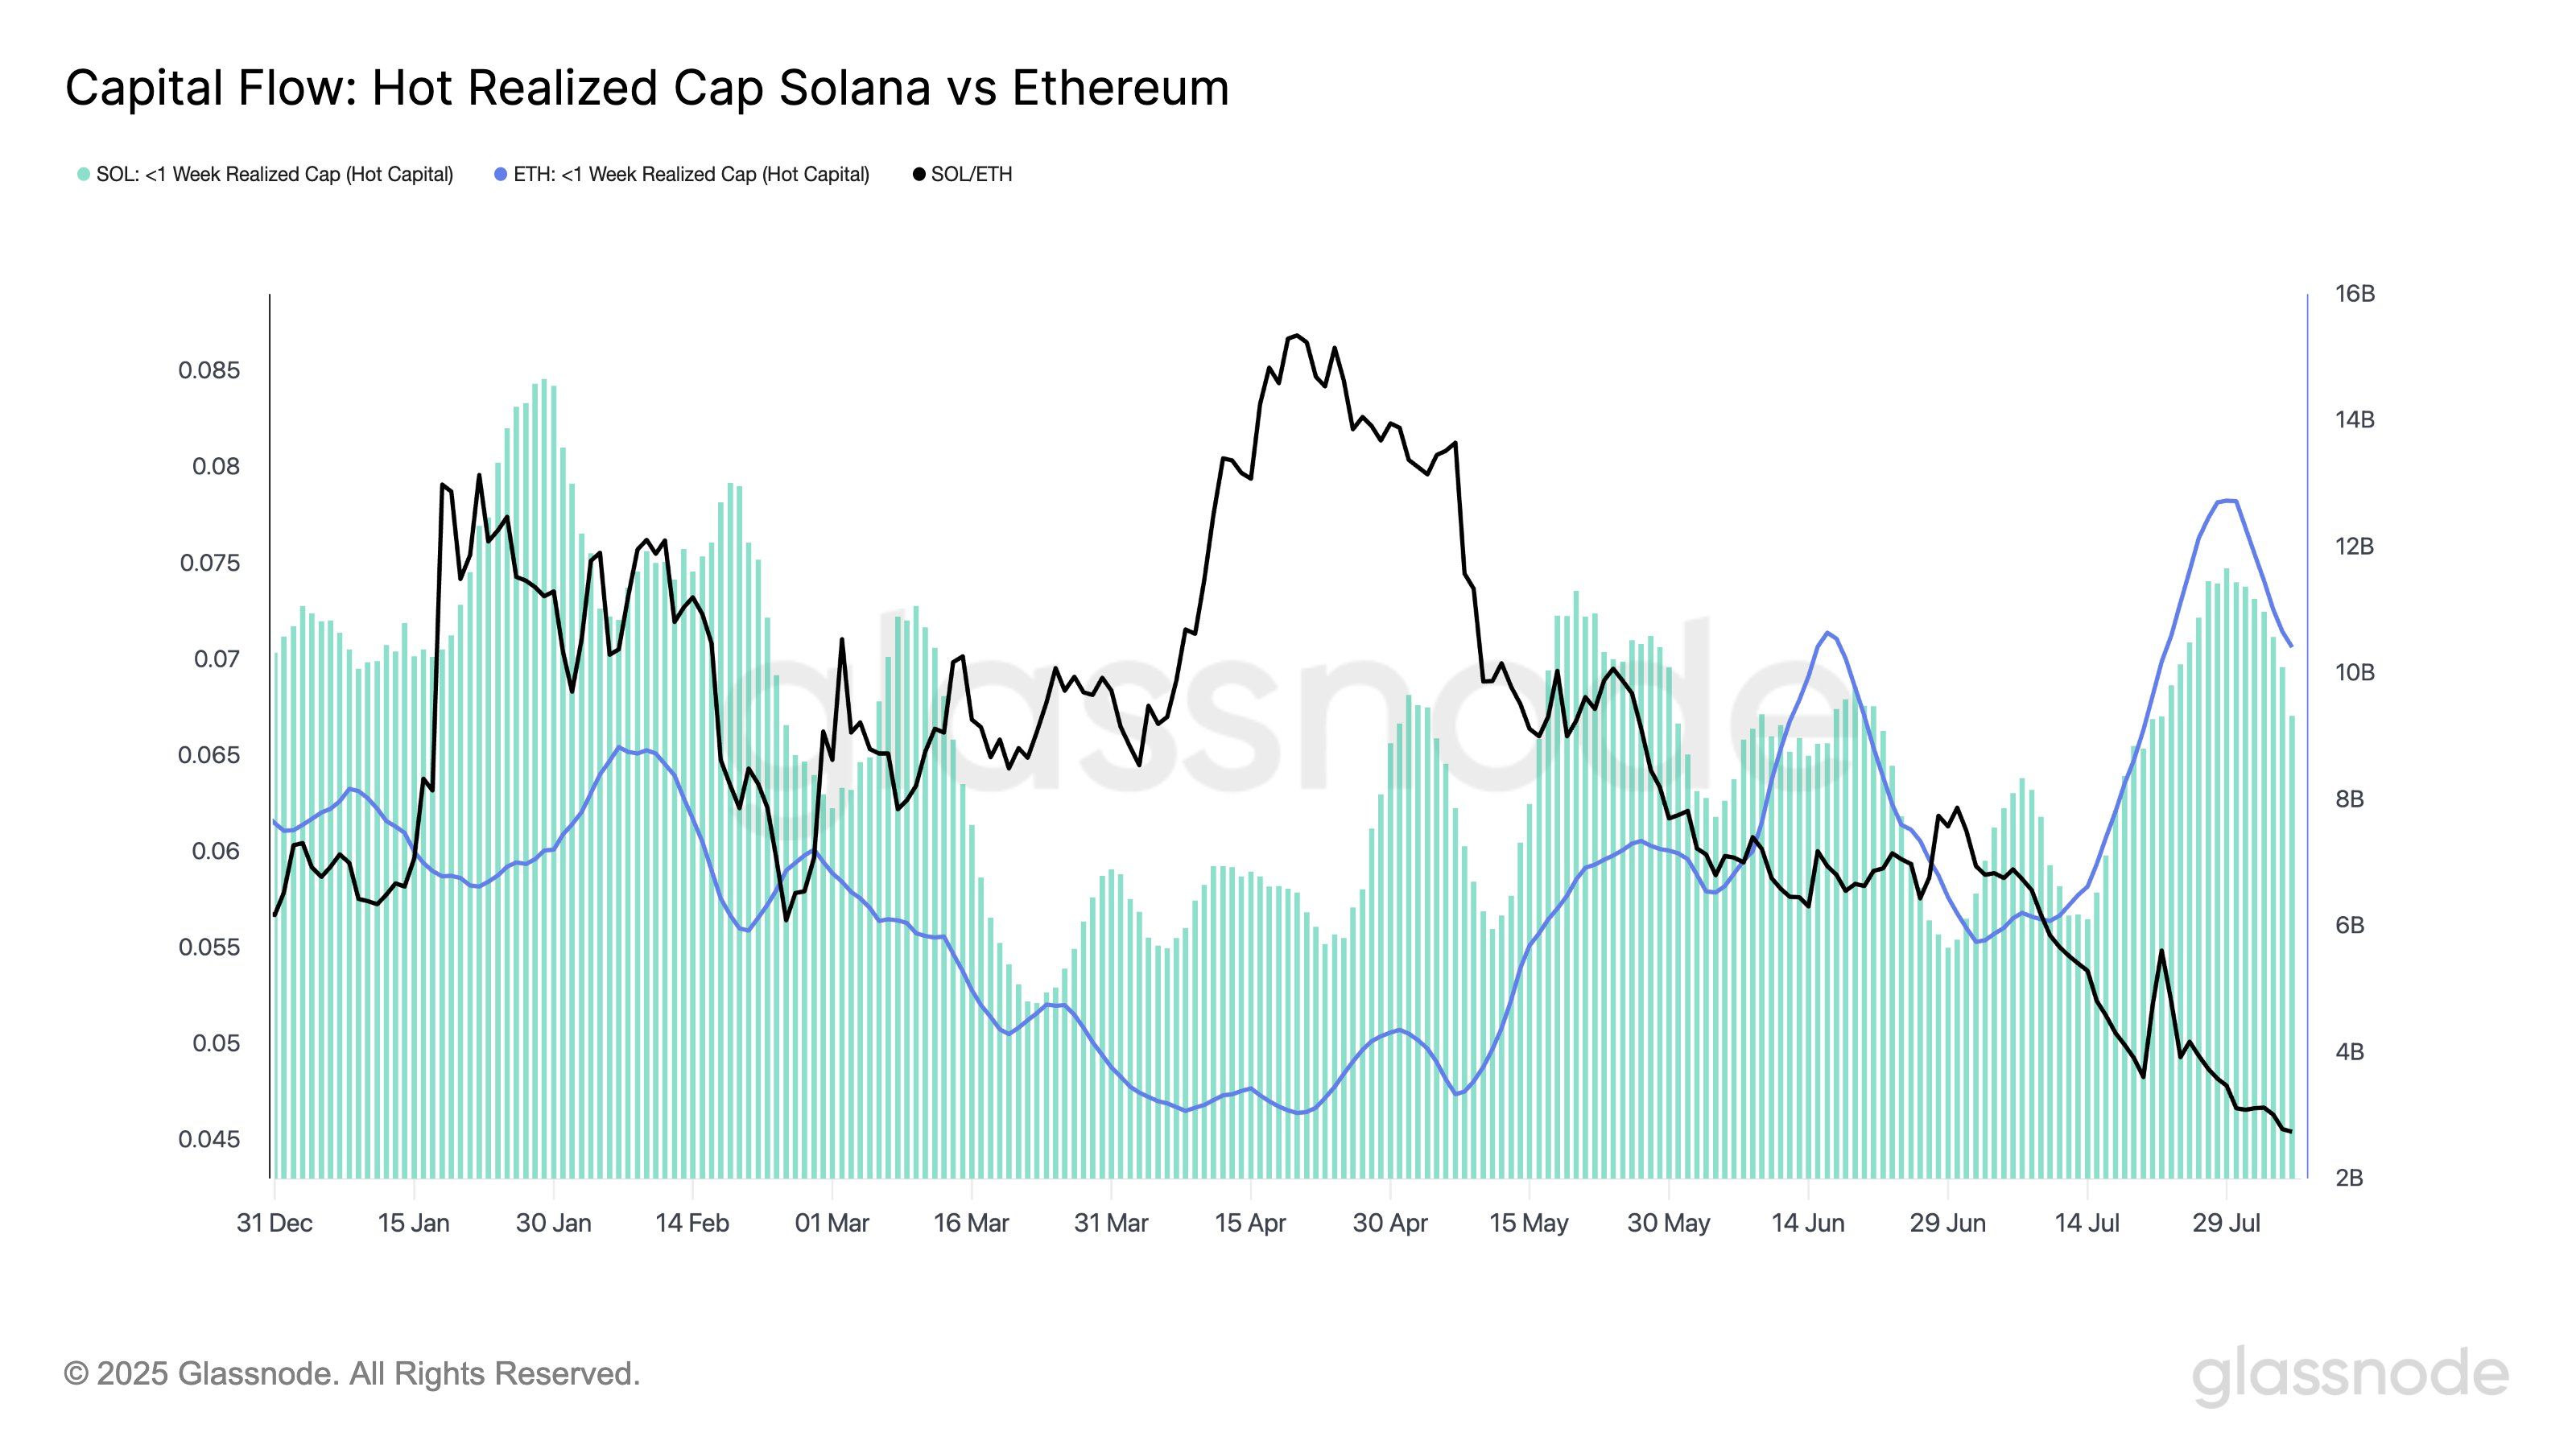 Capital flow: hot realized cap for Solana vs Ether. Source: Glassnode
The Hot Realized Cap metric shows which asset short-term speculators are favoring. With the ETH/SOL trading pair in a multimonth downtrend, the data signals “a fading but notable ETH-led rotation,” says Glassnode.
Another bullish sign for Ether is the ETH/BTC pair, which is also back to multimonth highs, rising above the 200-day exponential moving average for the first time in over two years.
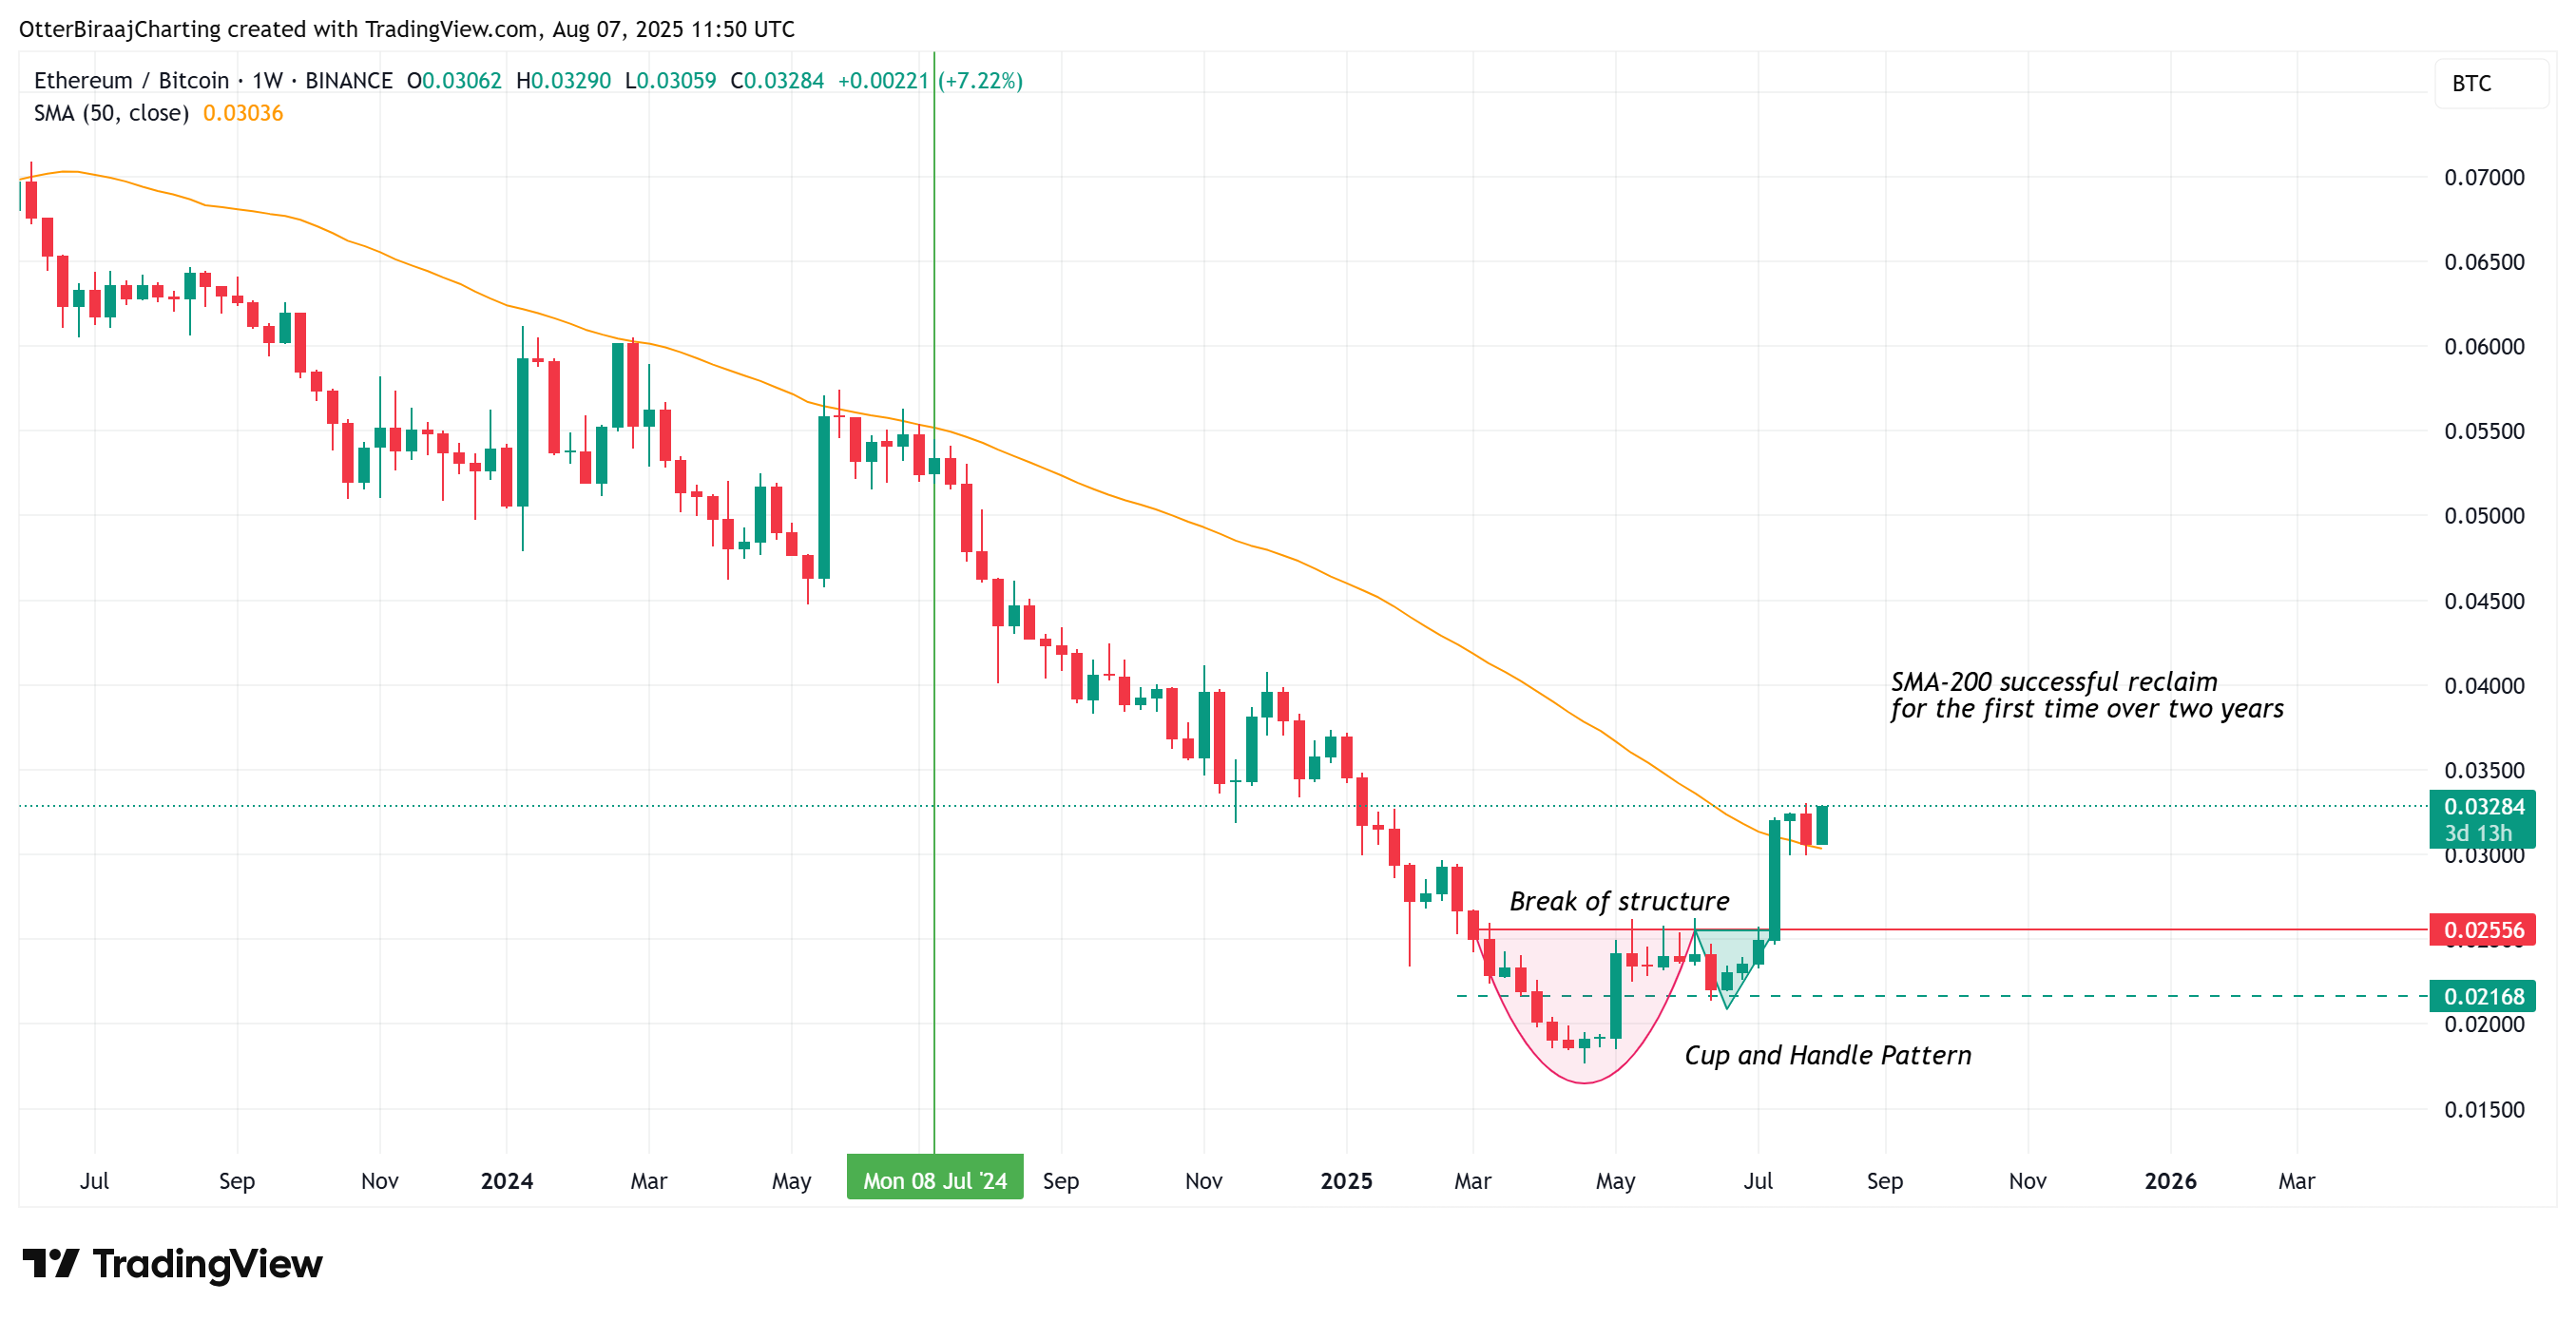 ETH/BTC one-week chart. Source: Cointelegraph/TradingView
As Cointelegraph reported, ETH price rebounded to its average trading range while Bitcoin continues to face heavy selling at $116,000 and below.
Ether funding rates stay cool
Ether’s open interest (OI) recently reached an all-time high of $58 billion. This surge in OI, alongside Ethereum’s record-high daily transaction count, reflects more money entering the market and increasing network participation.
Additionally, Ethereum’s share of total OI across major exchanges has climbed to 34.8%, while Bitcoin’s declined from 59.3% to 47.1%.
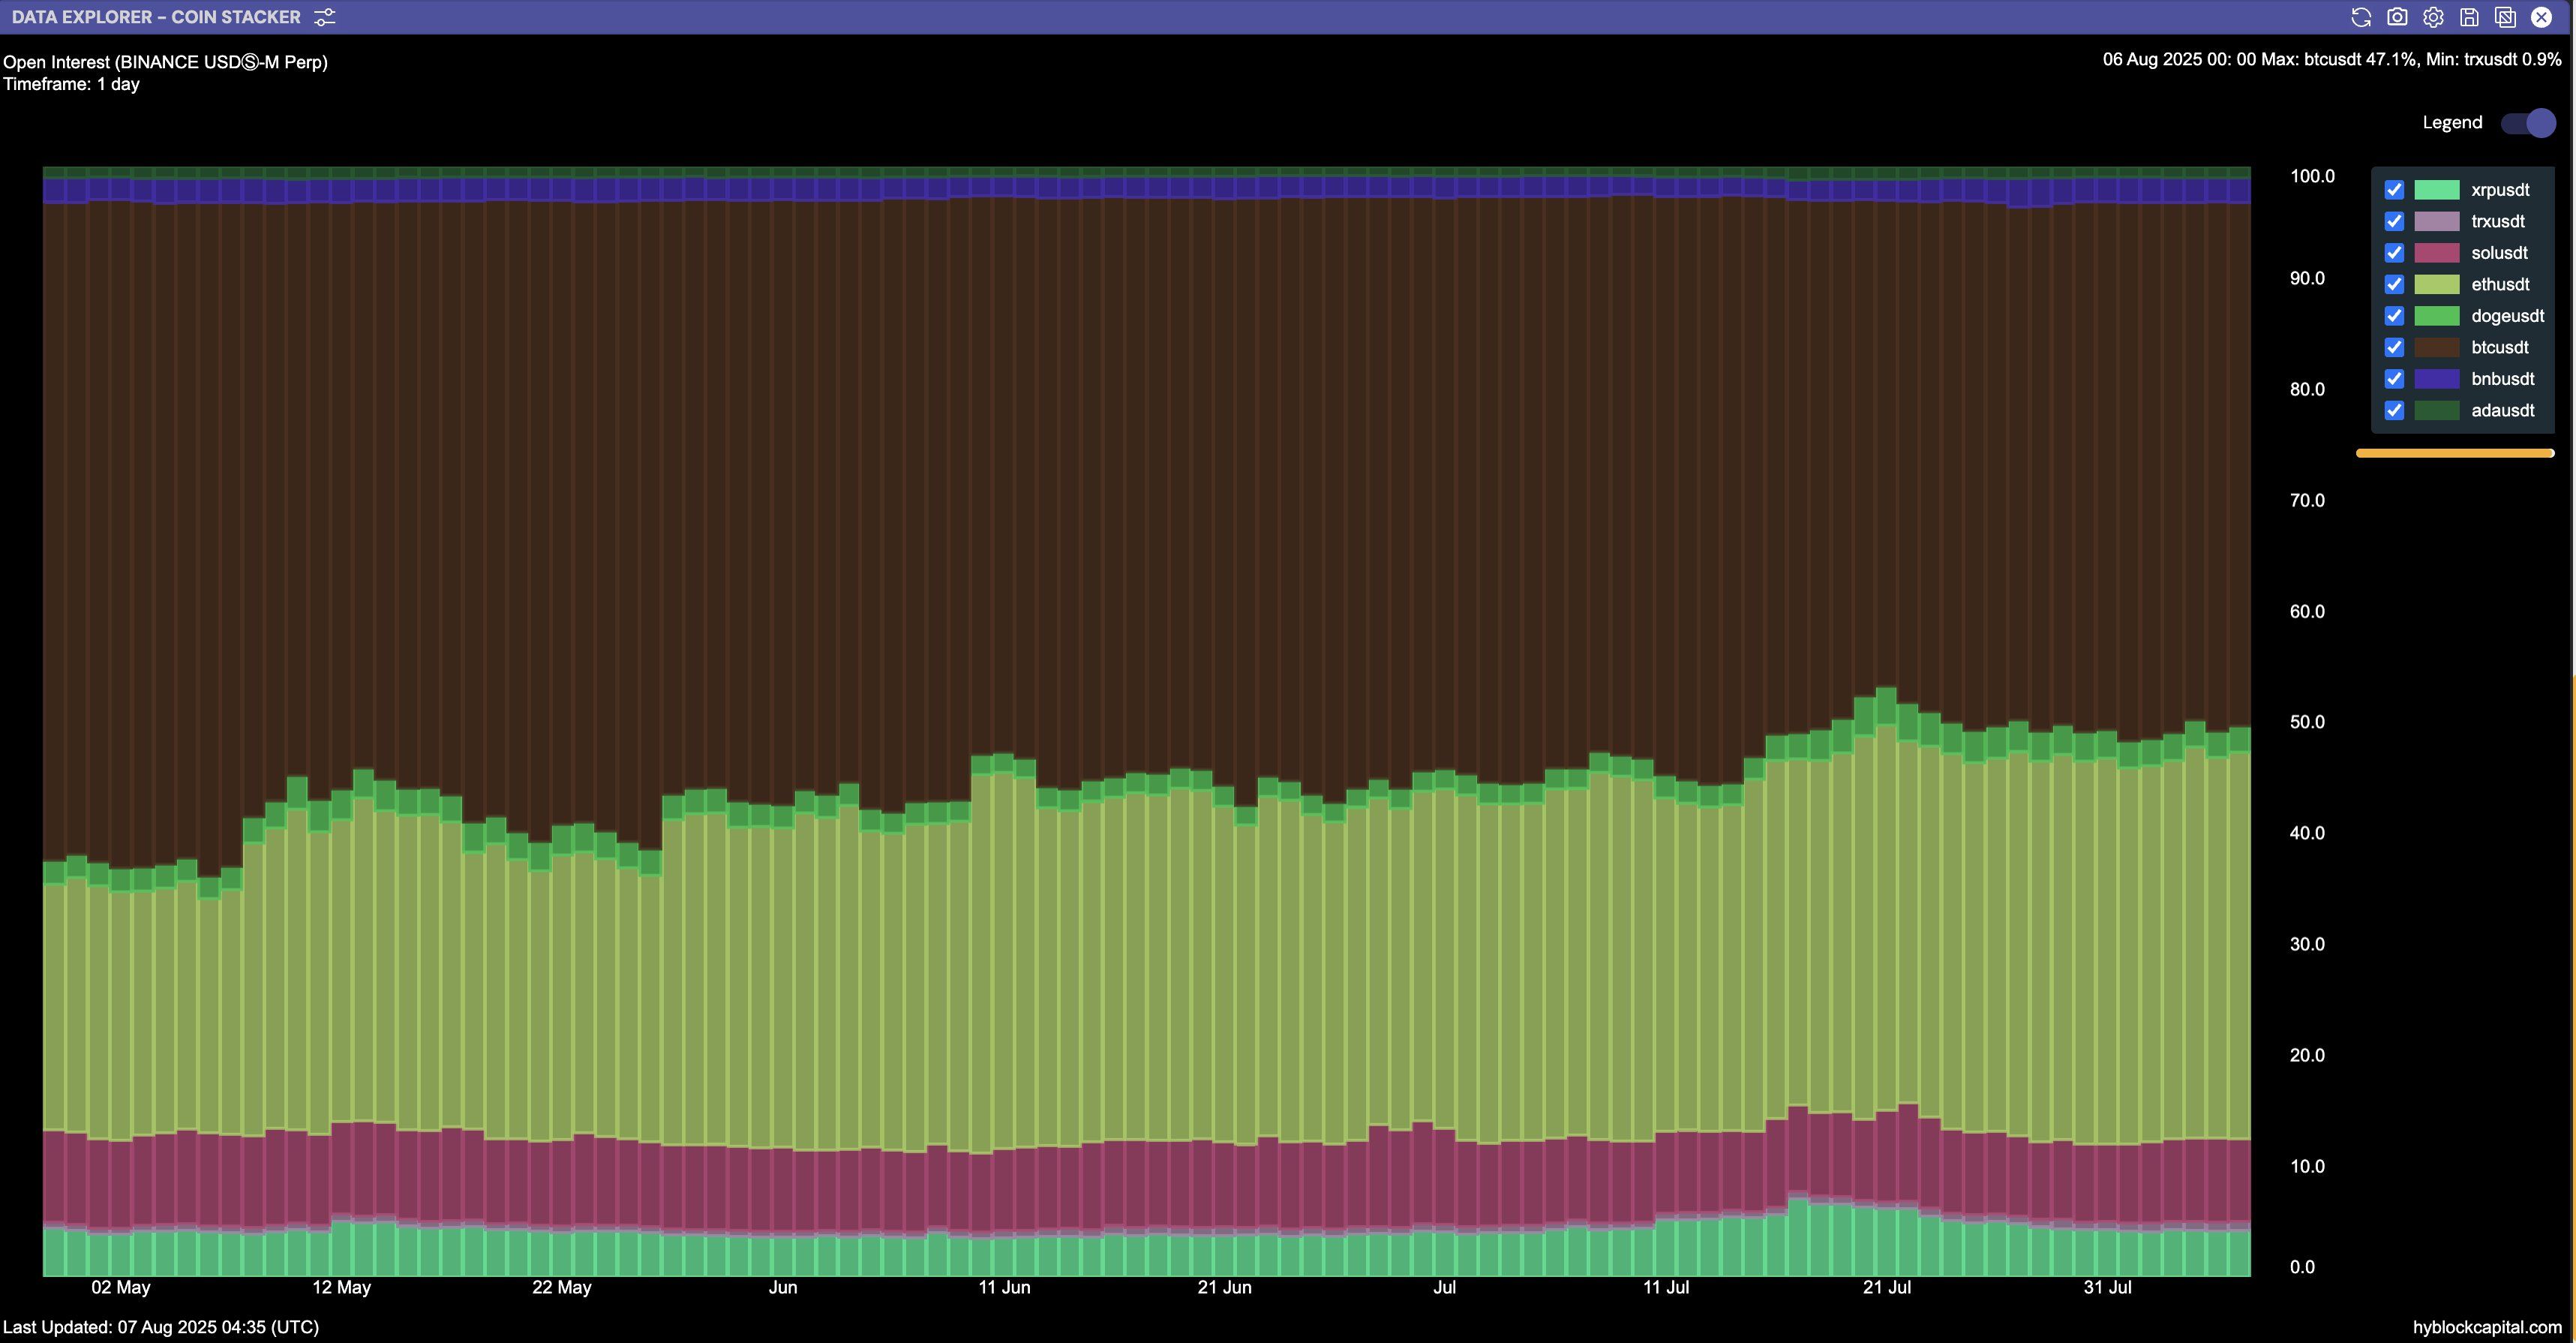 Ether open interest market share across exchanges. Source: Hyblock Capital/X
However, while ETH has yet to reclaim the key $4,000 resistance level, futures funding rates suggest the rally still has room to run.
Current aggregated funding rates remain significantly lower than during previous attempts to breach $4,000 in March and December 2024. In fact, compared to March, funding rates have nearly halved.
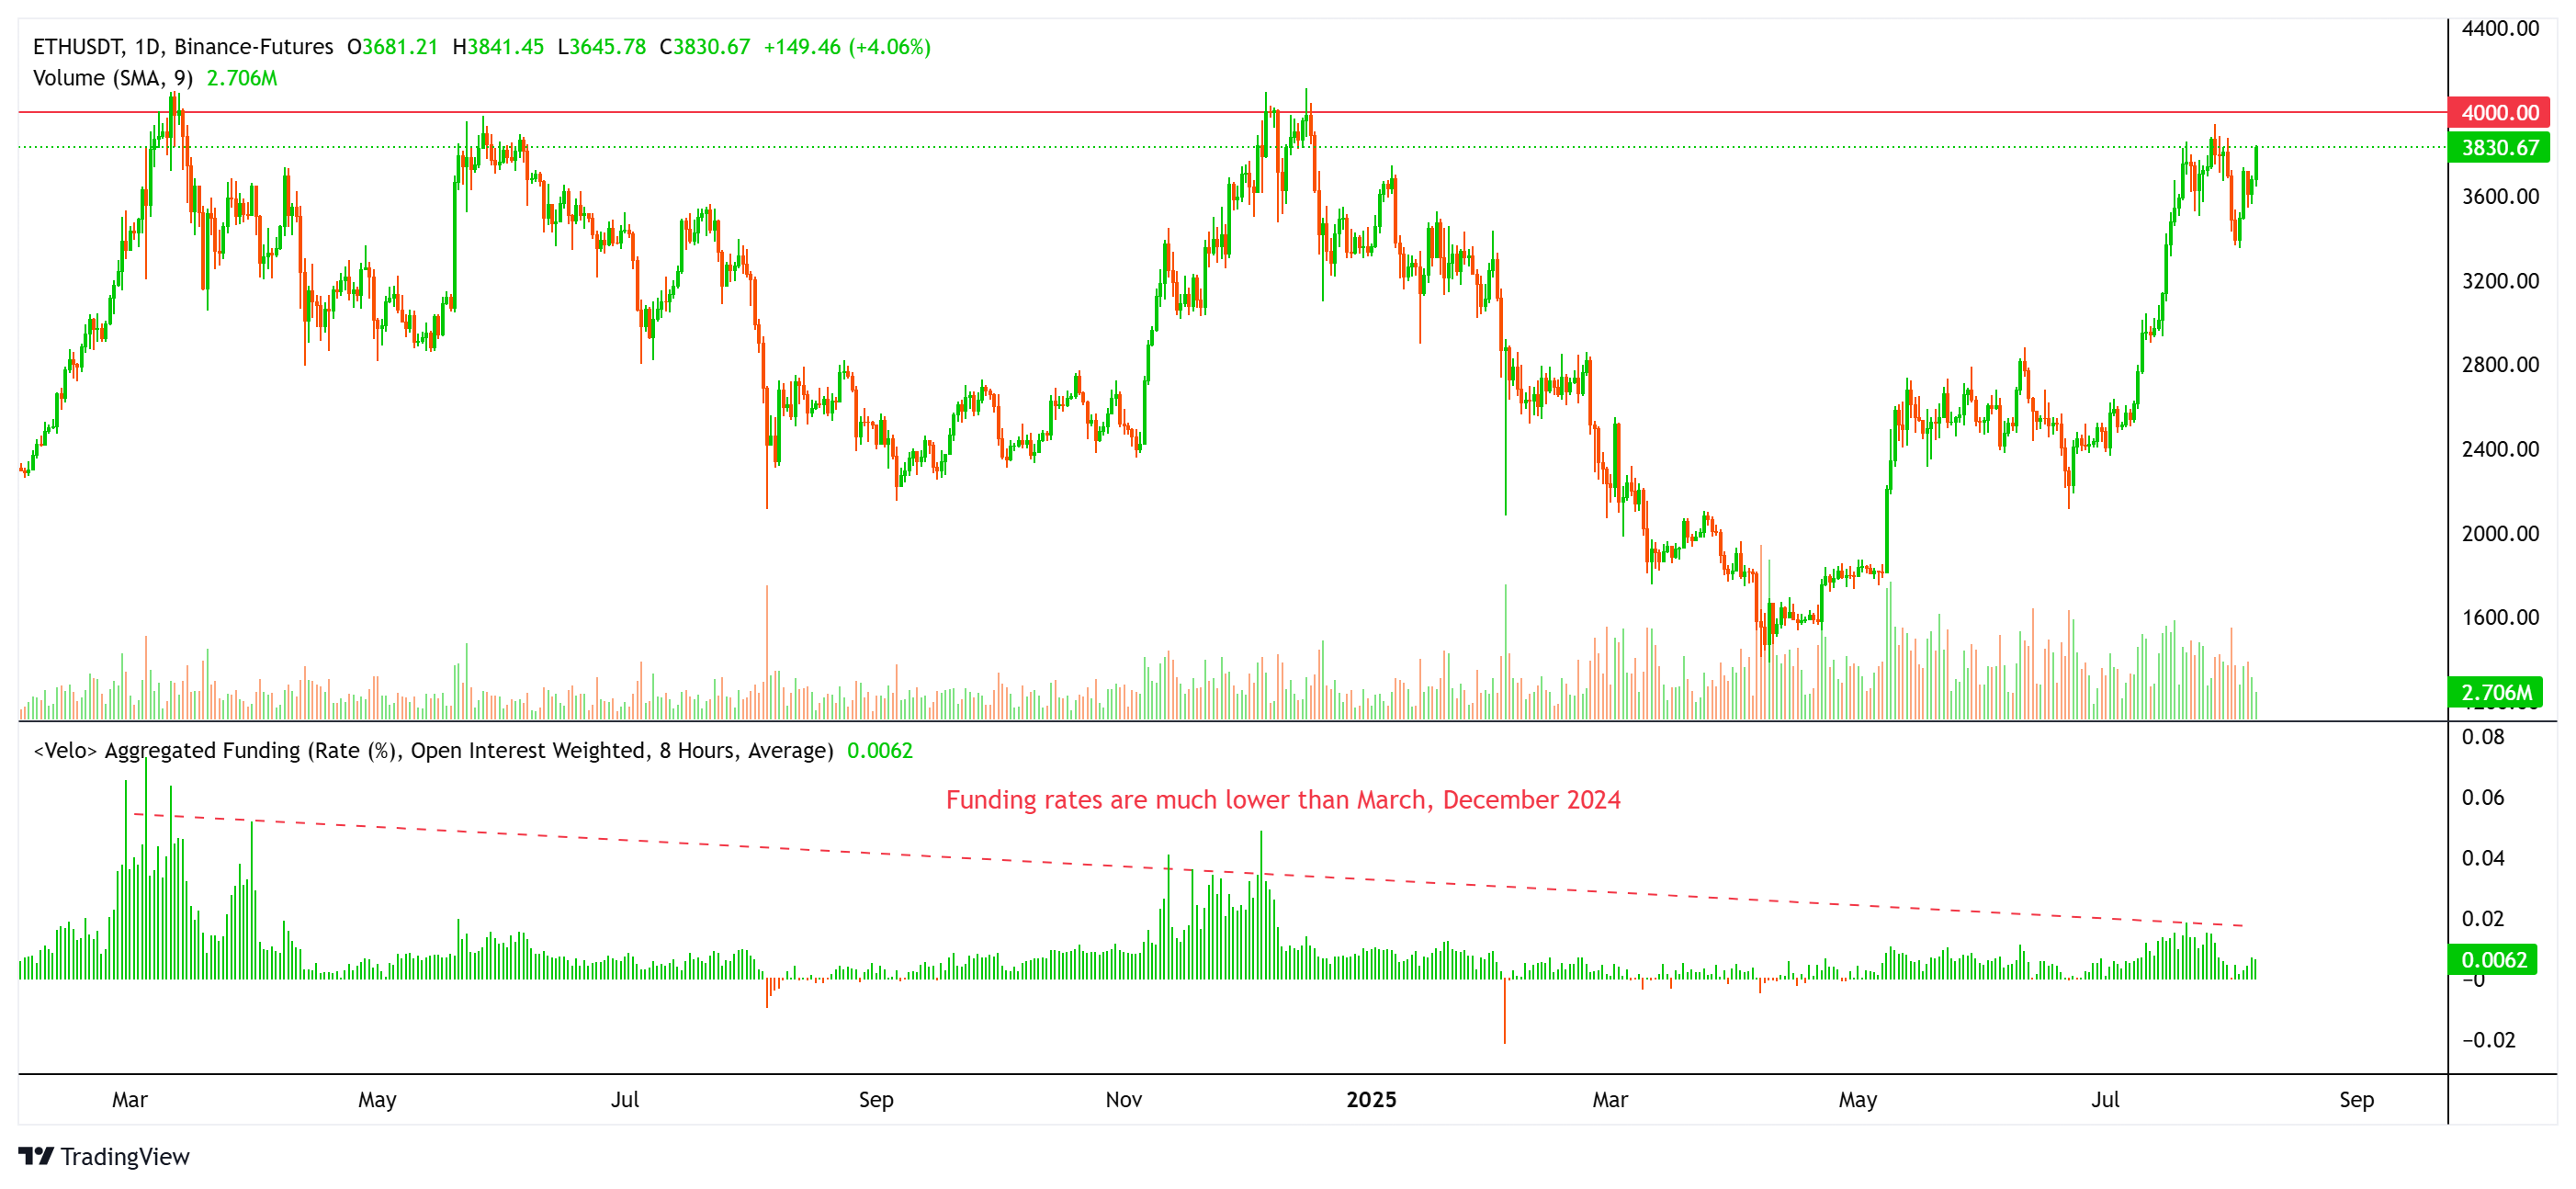 Ether price and aggregated funding rate chart. Source: Velo.data
This dynamic is bullish for two key reasons: First, lower funding rates indicate that traders are not overly leveraged to the long side, reducing the risk of sudden liquidation.
Second, it shows that the current price action is being driven more by spot demand (led by Ether treasury companies) rather than excessive speculative positioning.
In fact, NovaDius president Nate Geraci highlights,
“Eth treasury companies & spot eth ETFs have *each* bought approx 1.6% of current total eth supply since beginning of June.”
Related: Ether price headed for $4K showdown: Is this time different?
Ether price corrected by 9.72% over the past seven days after rallying for five consecutive weeks. ETH has swiftly recovered 9% since, retesting $3,800 on Thursday.
With $4,000 in sight, crypto analyst Jelle notes that the psychological level “has been resistance since forever.” The analyst says,
“Once it breaks, I doubt we go back below anytime soon. Price discovery is close.”
Key Takeaways
- Capital Rotation: Ether is now the favored asset in capital inflows, surpassing Solana.
- Futures Dominance: ETH’s open interest has reached a record $58 billion, indicating strong market participation.
- Resistance Level: The $4,000 mark is a critical psychological barrier that ETH is approaching.
Conclusion
In summary, Ethereum is currently leading the market with significant capital inflows and a growing futures presence. With the $4,000 resistance level in sight, the coming weeks will be crucial for ETH’s price trajectory. As market dynamics evolve, Ether’s position as a dominant player in the crypto space is becoming increasingly evident.
Frequently Asked Questions
What are the current trends in Ethereum’s market?
Ethereum is currently leading in capital inflows and futures market dominance, indicating a strong bullish sentiment among investors.
How does Ethereum compare to Solana in terms of capital flows?
Ethereum has outpaced Solana significantly, with a notable decline in Solana’s Hot Capital Ratio, indicating a shift in investor preference.