

Date: Sat, Aug 16, 2025 | 06:50 AM GMT
The cryptocurrency market is undergoing a healthy cooldown as Ethereum (ETH) retreats to $4,420 after recently peaking near $4,780. This pullback has weighed on most major altcoins — and Sui (SUI) is no exception.
SUI has slipped about 4% in today’s session, extending the pressure on buyers. More importantly, its latest price action is echoing a familiar bearish fractal that may be signaling a more correction ahead.
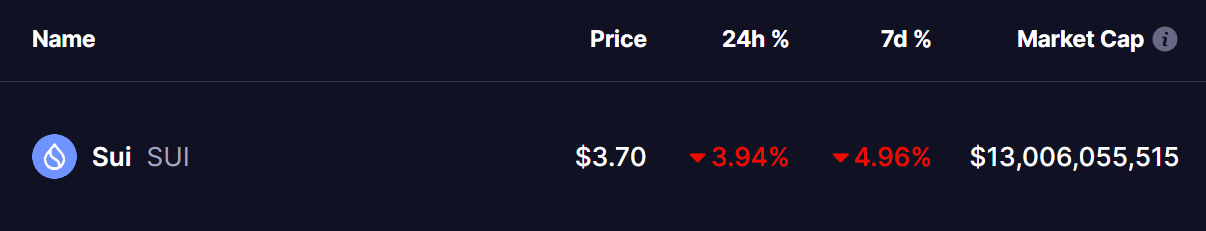 Source: Coinmarketcap
Familiar Pattern Hints at Potential Pullback
On the daily timeframe, SUI has been moving inside a broad rising wedge pattern — a structure often associated with slowing bullish momentum and looming reversals.
The chart reveals a clear repeating sequence. In the last cycle, SUI rallied strongly after a bullish moving average crossover (blue circle), pushing toward the wedge’s upper boundary. That rally eventually stalled, followed by a decisive break below the 25-day moving average, which sent the token sliding toward the 100-day MA (green circle). While the 100-day MA initially offered support, SUI failed to sustain a rebound. The red circle highlights this failed recovery attempt, which was then followed by a sharp 34% drawdown to the wedge’s lower trendline.
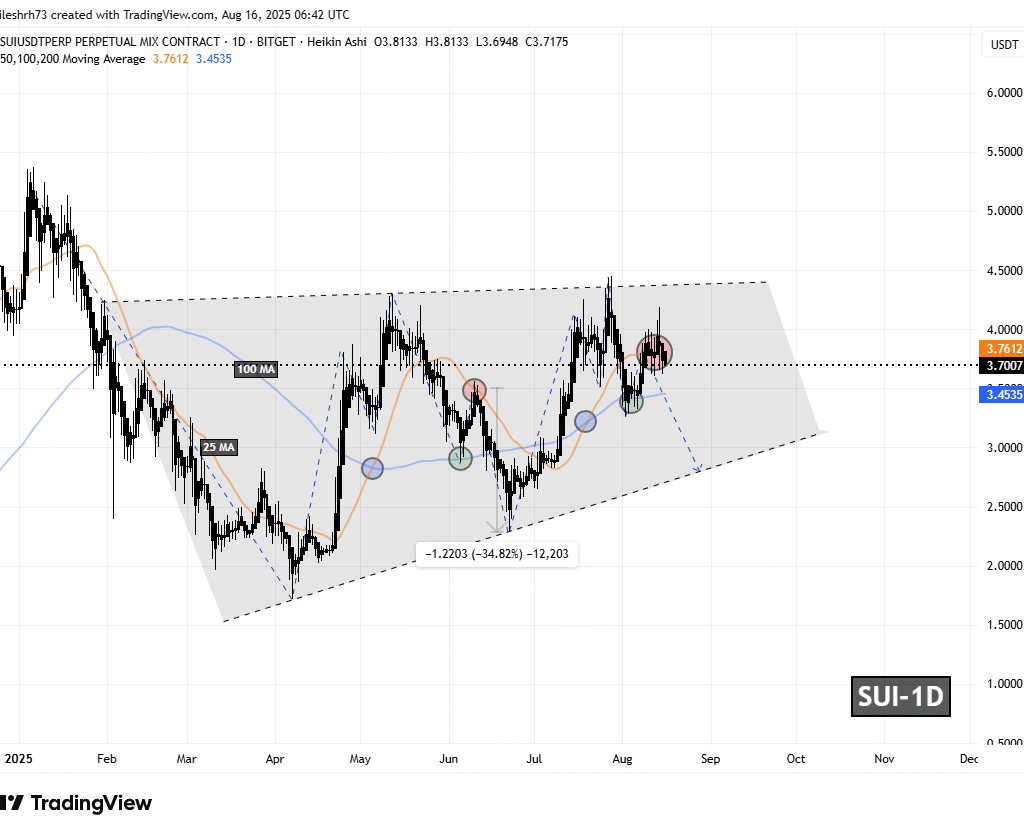 Sui (SUI) Daily Chart/Coinsprobe (Source: Tradingview)
Now, history seems to be rhyming.
SUI has once again bounced from the 100-day MA, reclaimed the 25-day MA, and then broken down again. It is currently trading near $3.70, hovering just above the crucial 100-day MA support at $3.45. This setup closely mirrors the conditions that preceded the previous steep decline.
What’s Next for SUI?
If the 100-day MA at $3.45 fails to hold, it would validate the emerging bearish fractal and likely trigger another leg down. The next major support sits near the wedge’s lower boundary around $2.80, implying a potential 24% downside from current levels.
On the flip side, if buyers manage to defend the 100-day MA and reclaim the 25-day MA in the coming days, the bearish thesis would weaken. In such a case, SUI could mount another push toward the wedge’s upper resistance, allowing the broader uptrend structure to remain intact.