Stellar Price Risks 40% Drop As Three Bearish Setups Align

Stellar price trades near $0.39 as bearish setups align. Falling open interest, crossovers, and a triangle pattern put key levels at risk.
Stellar (XLM) has given back ground after a strong run earlier this year. The token is down 16.1% in the past month, slipping 8.2% this week, and losing another 1.7% in the past 12 hours. Yearly gains still stand near 300%, but several bearish signals suggest sellers may have more room to press.
For long holders, the next few sessions could decide whether Stellar defends support or faces a steep correction.
Derivatives Weakness Cuts Support
One of the first warnings comes from the derivatives market. Open interest, which measures the value of active futures contracts, often shows how much leverage is behind a move. When open interest is high, traders can drive prices sharply in either direction, often triggering squeezes.
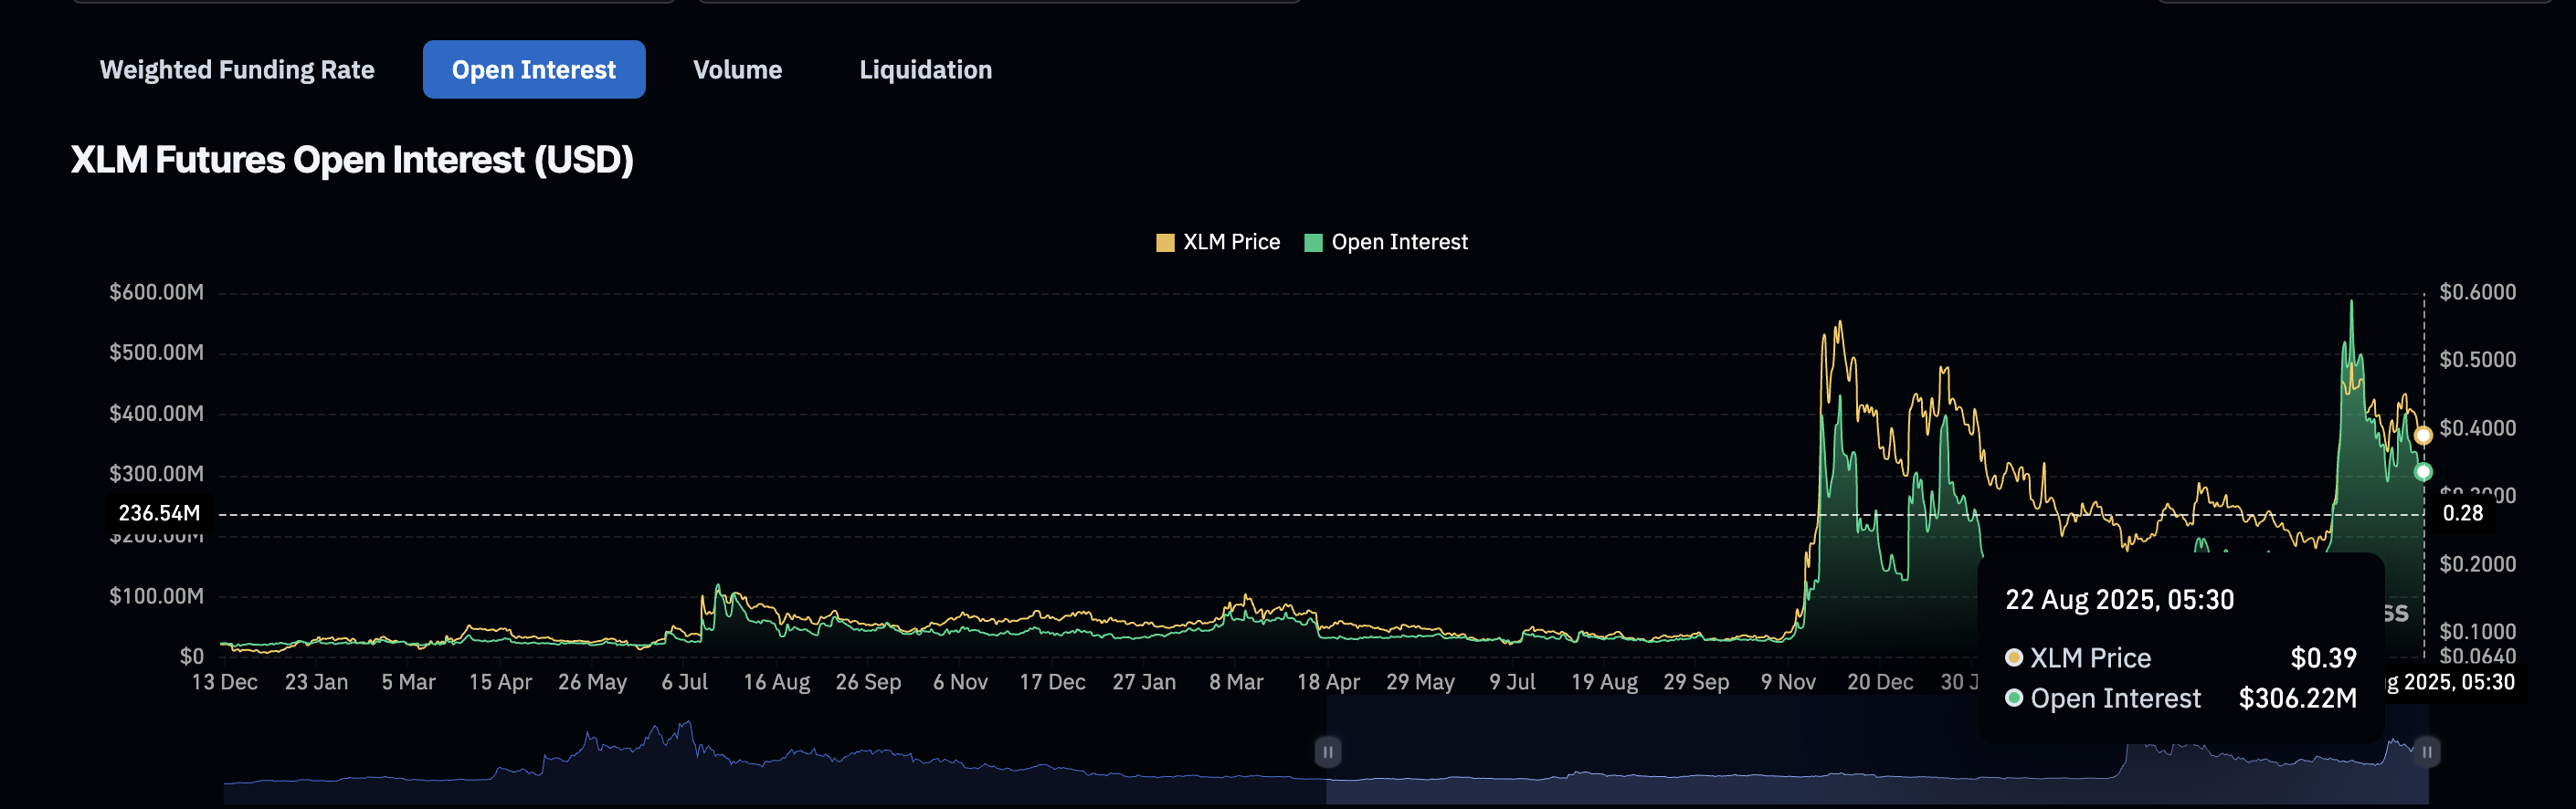 Stellar open interest is taking a hit:
Coinglass
Stellar open interest is taking a hit:
Coinglass
On July 18, Stellar’s open interest touched $588.53 million as the XLM price rallied. That buildup of leverage helped fuel the move, with short squeezes adding momentum. Since then, open interest has dropped to $306.22 million — a fall of almost 50%.
With fewer contracts in play, the chance of another squeeze-led rally weakens, leaving the market more exposed to spot selling.
For token TA and market updates: Want more token insights like this? Sign up for Editor Harsh Notariya’s Daily Crypto Newsletter here.
Bearish Crossover (s) Build Pressure
Spot momentum has also tilted negative on smaller timeframes, which often show early trend shifts.
 Stellar price chart and bearish crossover confirmed:
TradingView
Stellar price chart and bearish crossover confirmed:
TradingView
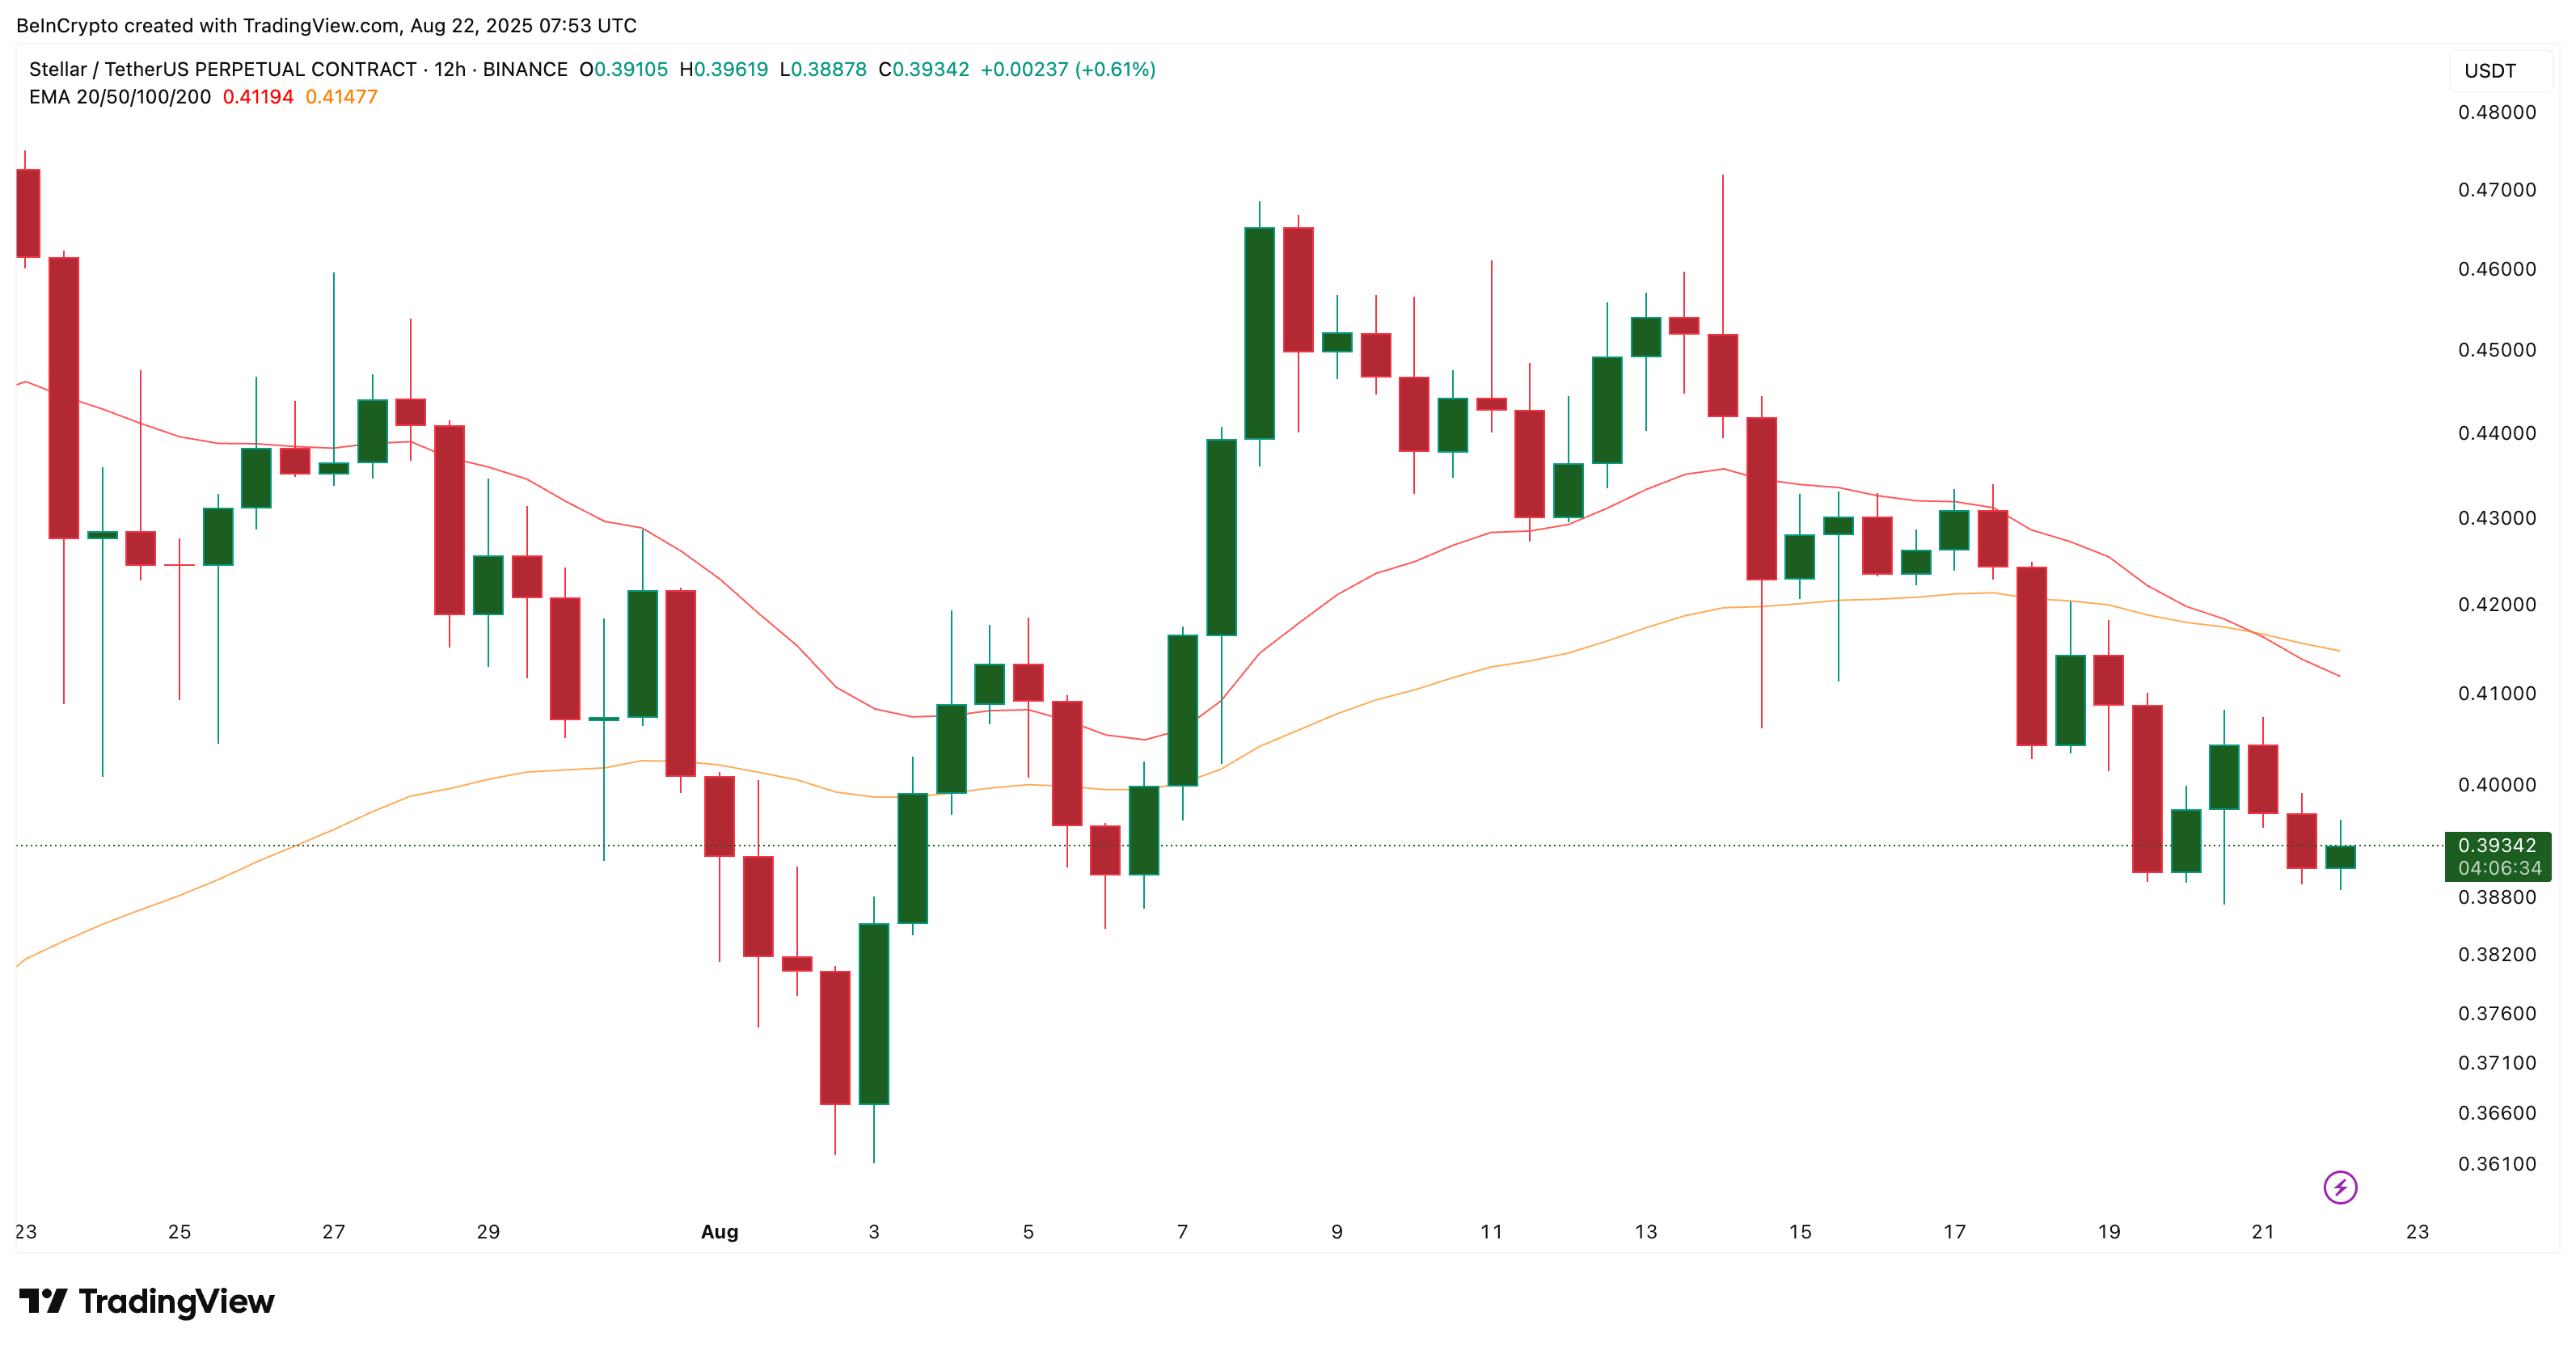
On the 12-hour Stellar price chart, the 20 EMA or Exponential moving average (red line) crossed below the 50 EMA (orange line), a bearish signal that shows sellers have taken short-term control.
 Stellar price chart and bearish crossover forming:
TradingView
Stellar price chart and bearish crossover forming:
TradingView
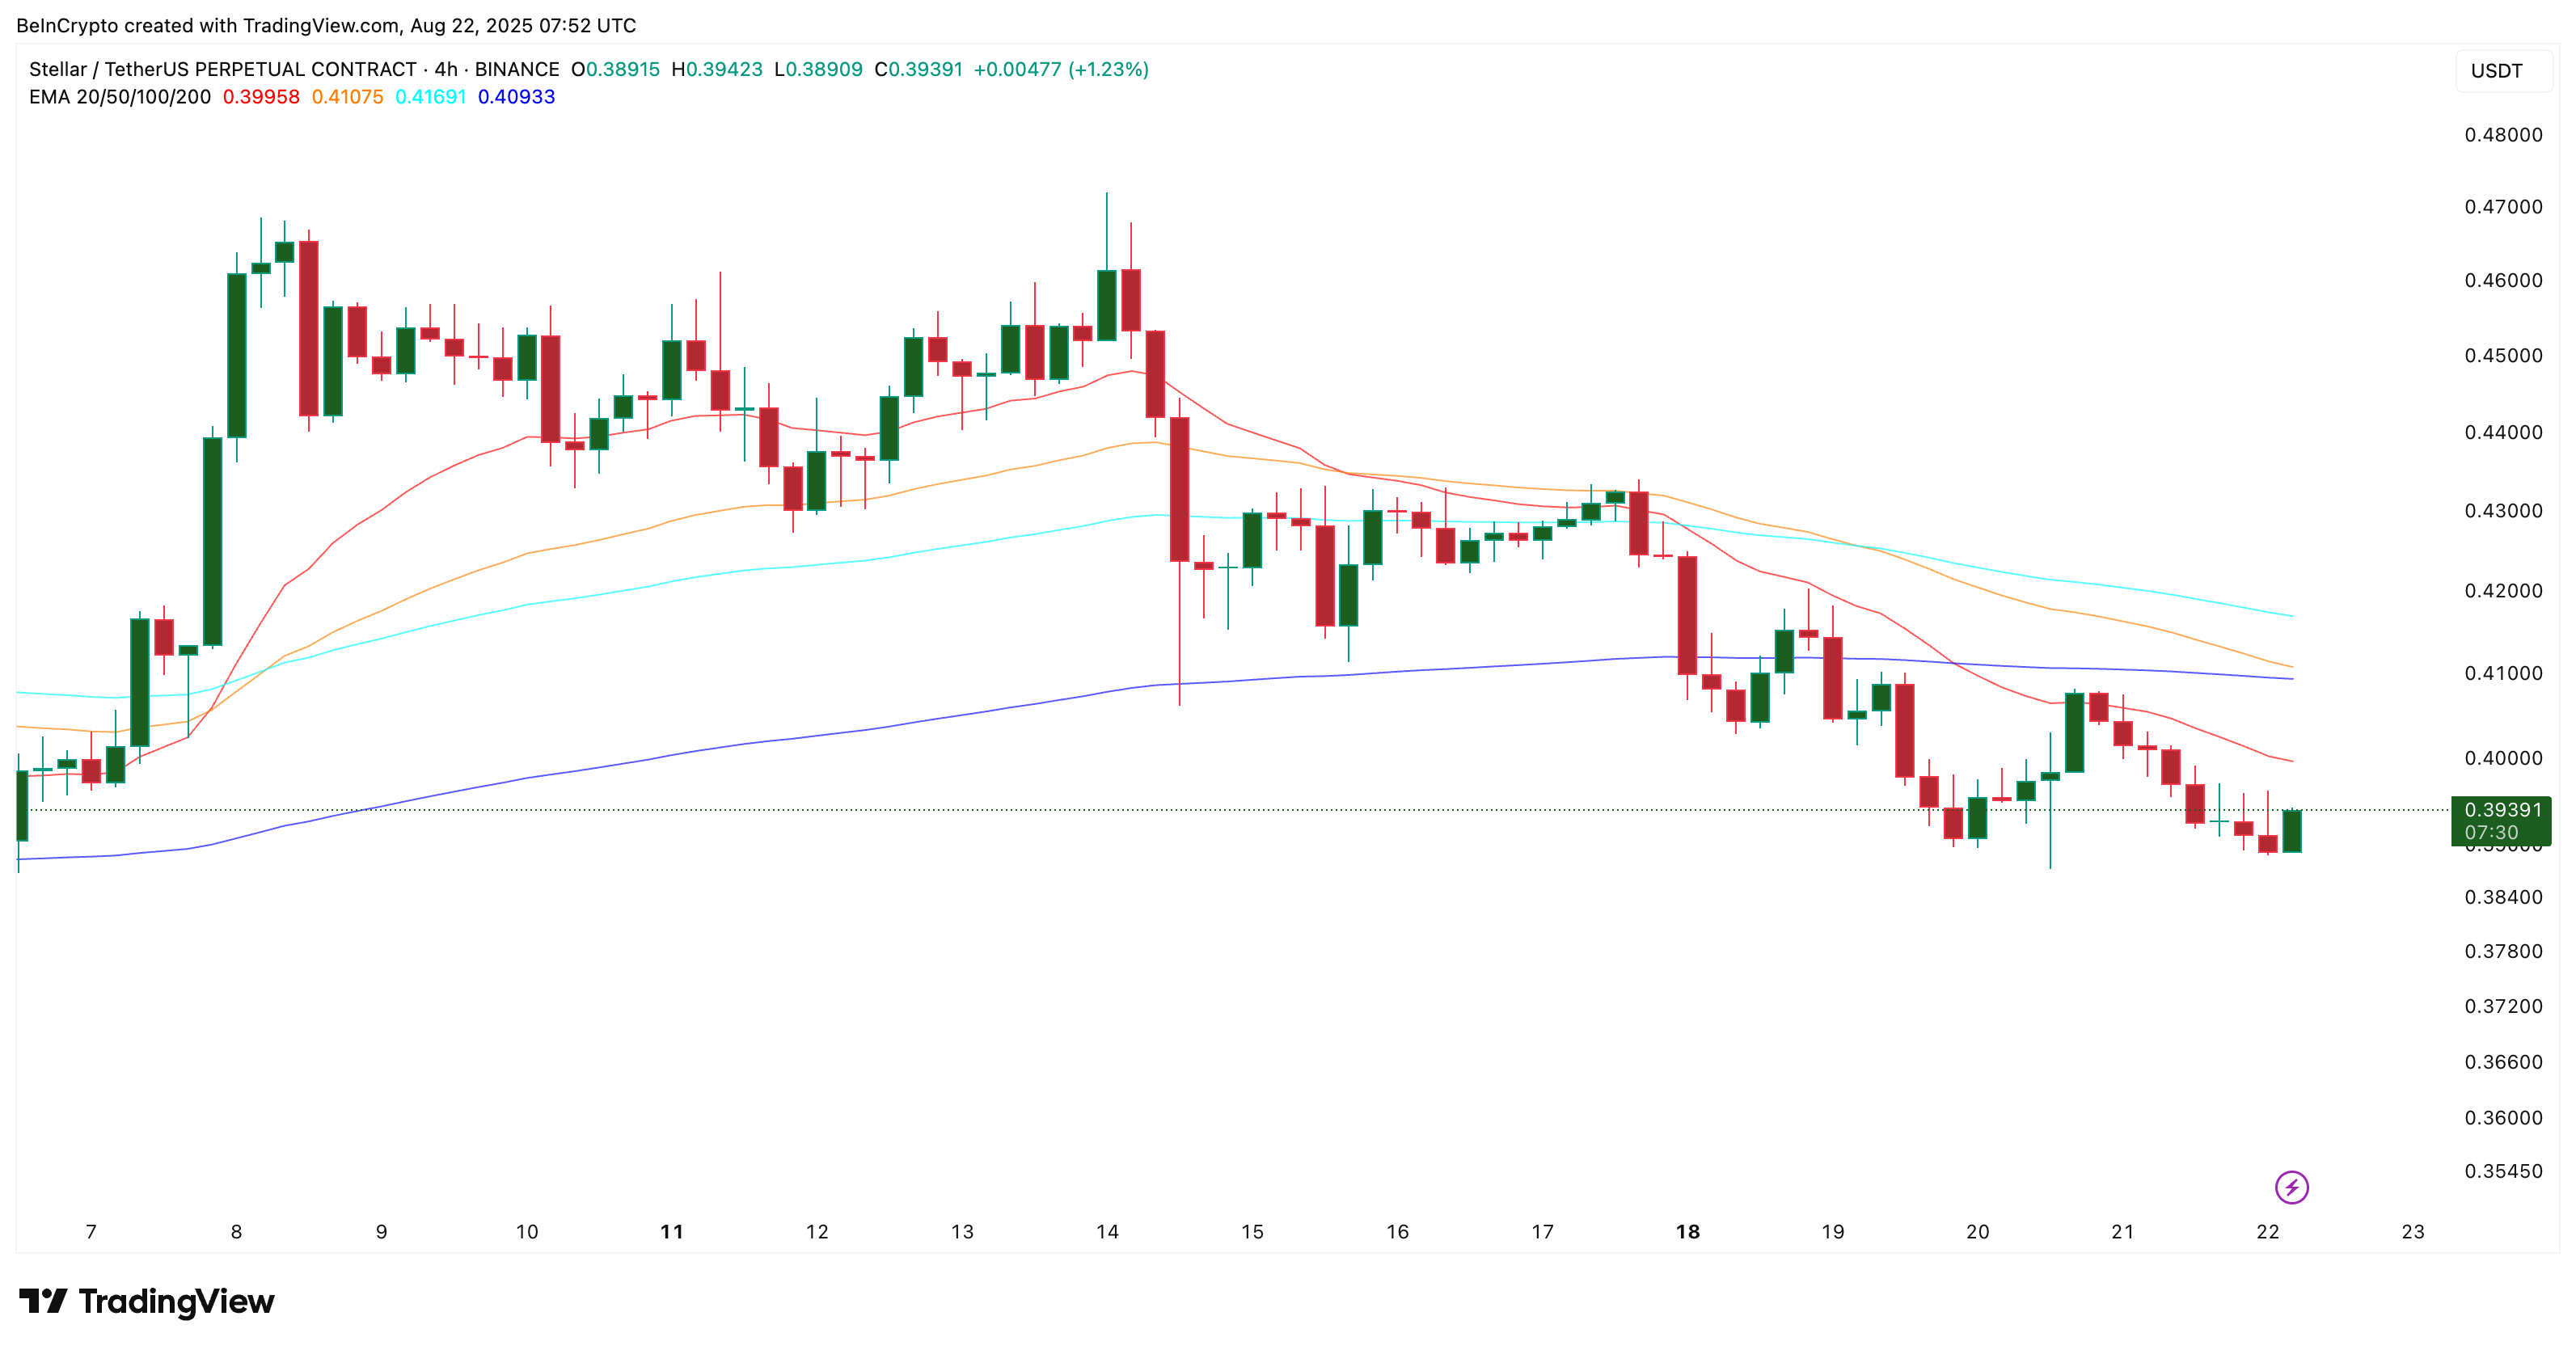
On the 4-hour Stellar price chart, the 50 EMA is close to crossing under the 200 EMA (deep blue line). A similar cross earlier this month preceded a drop. If confirmed, it would add another layer of selling pressure and strengthen the bearish bias.
Exponential Moving Average (EMA) is a moving average that gives extra weight to recent prices, so it reacts faster than a simple average. A bearish crossover occurs when a shorter EMA/MA moves below a longer one, indicating that sellers have the momentum.
Triangle Pattern Points To Stellar Price Breakdown Risk
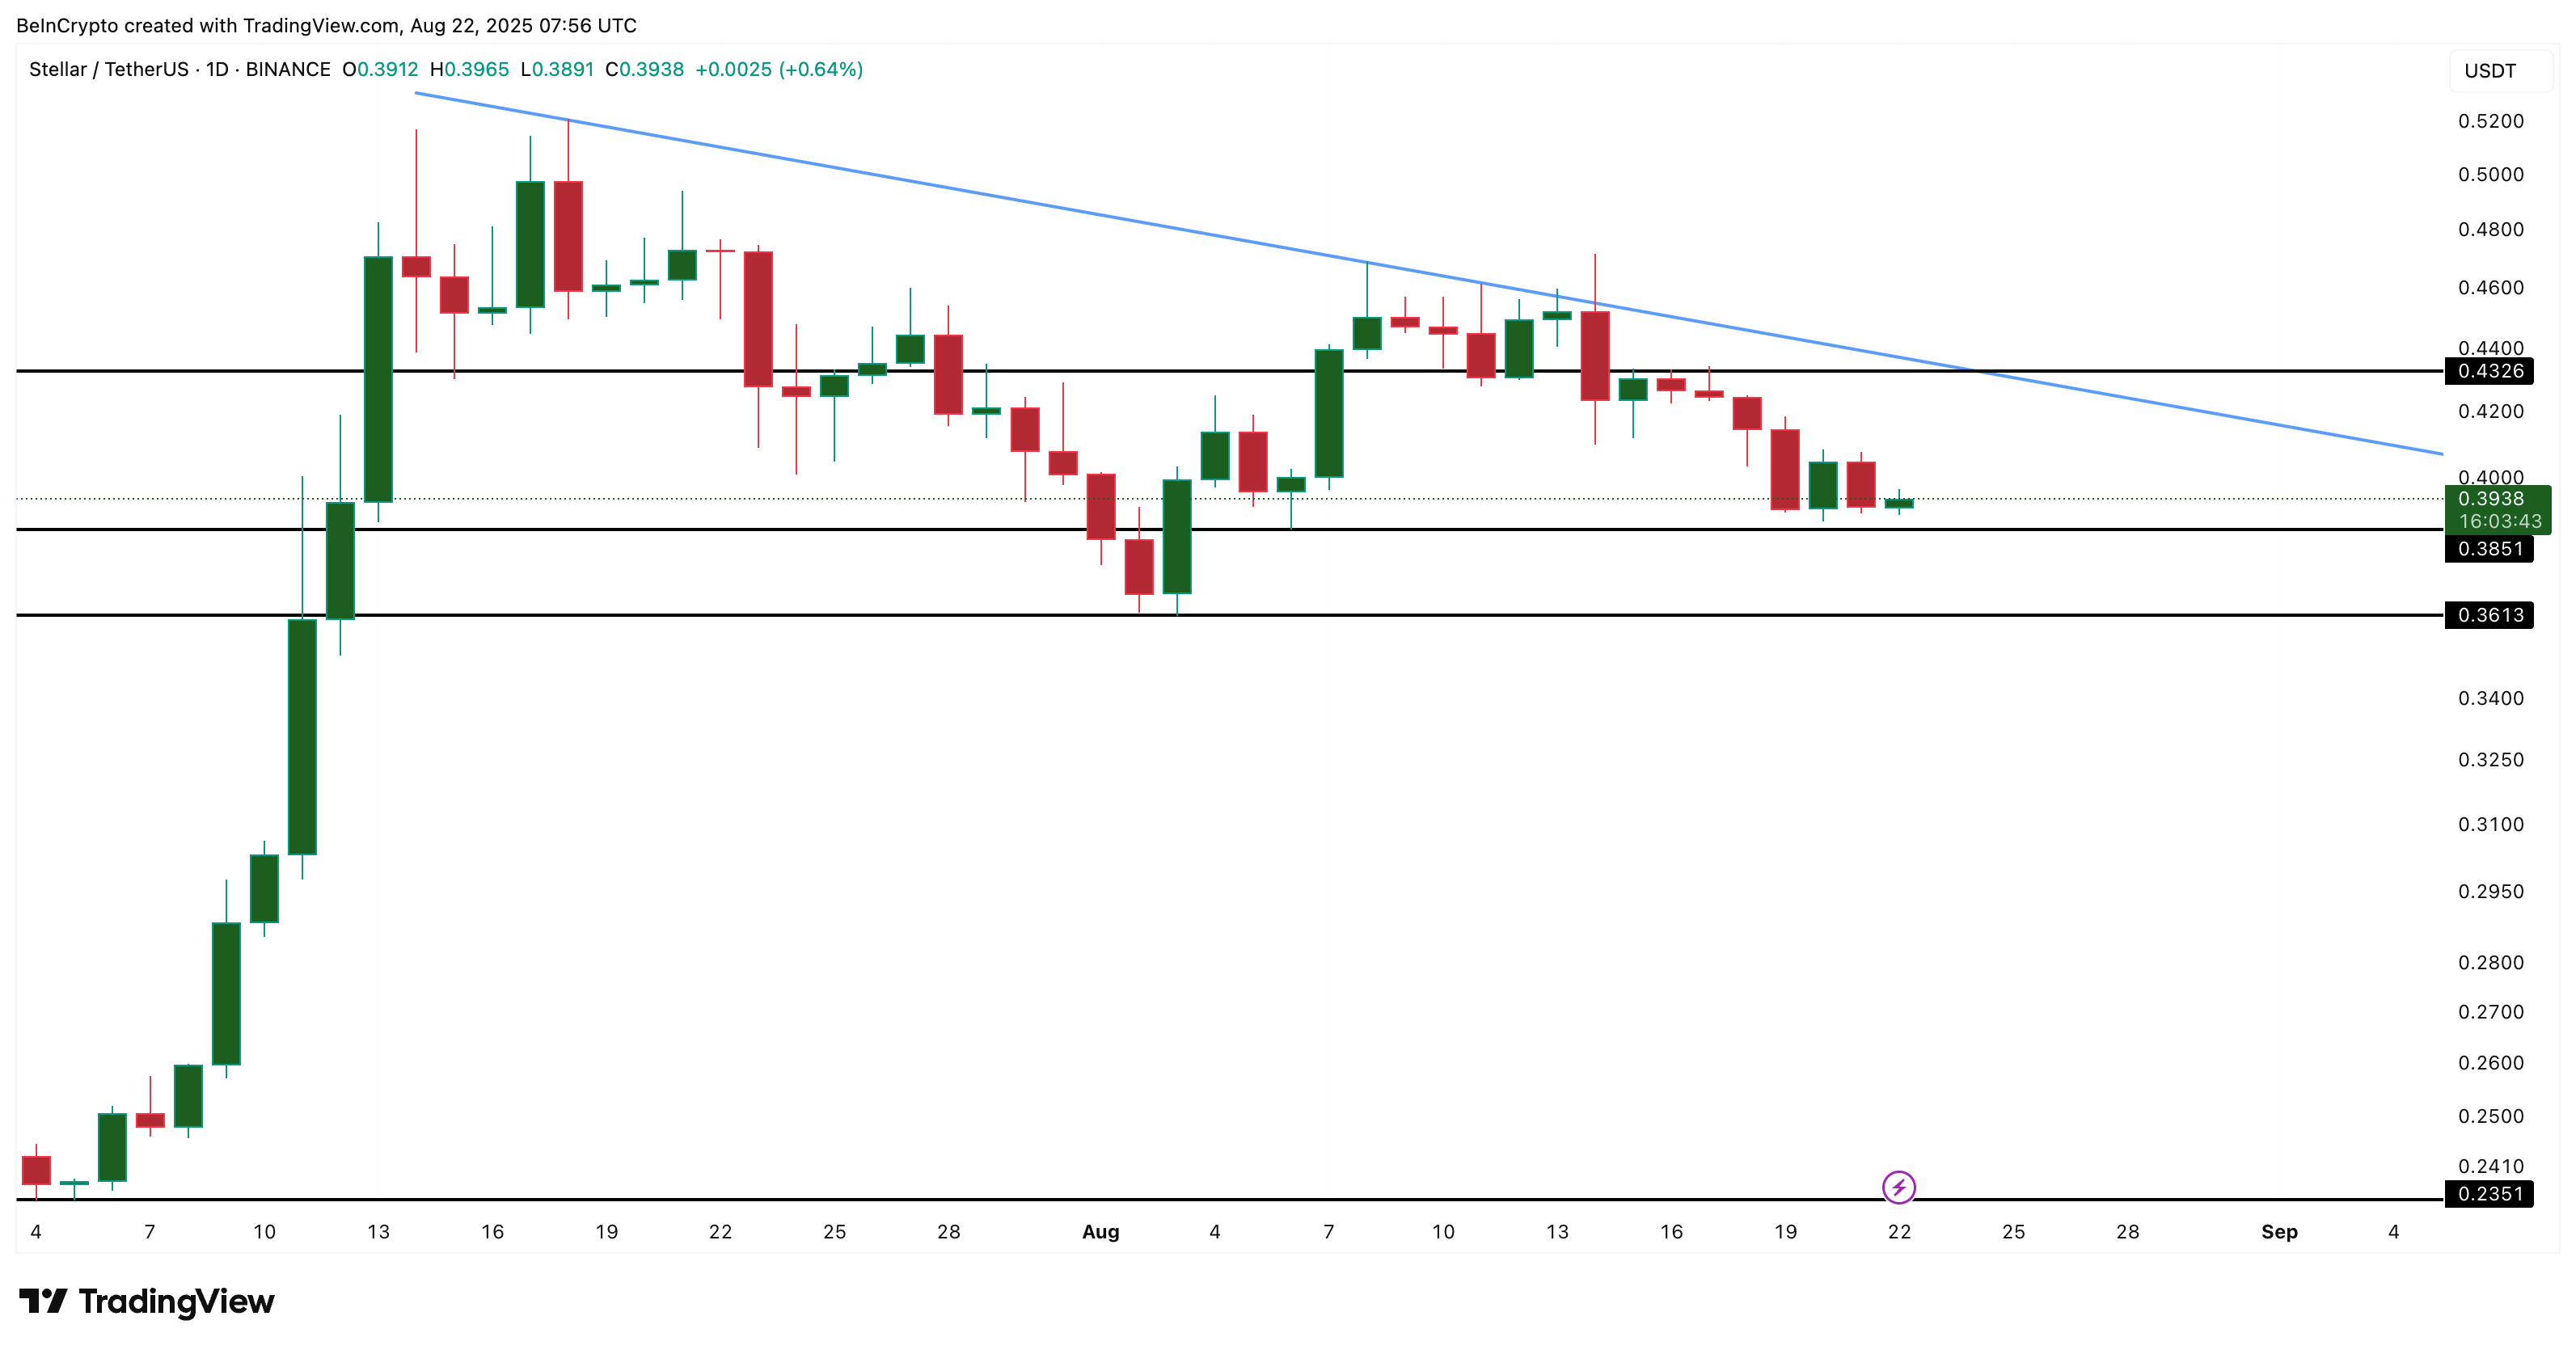
On the daily Stellar price chart, XLM trades inside a descending triangle, a bearish continuation pattern marked by lower highs pressing against flat support.
 Stellar price analysis:
TradingView
Stellar price analysis:
TradingView
Price sits near $0.39, just above key support at $0.38 and $0.36. If these levels fail, the lack of strong technical support points to a slide toward $0.23, a drop of nearly 40% from current levels.
Stellar now faces pressure from three sides: falling derivatives activity, bearish crossovers on short- and mid-term charts, and a descending triangle threatening a breakdown. Together, these setups highlight the risk of a 40% drop, unless buyers can quickly reclaim higher ground.
For buyers, the invalidation level is clear. A close above $0.43 would break the triangle to the upside, canceling the bearish setup and opening room for recovery. Until then, sellers remain in control.
Disclaimer: The content of this article solely reflects the author's opinion and does not represent the platform in any capacity. This article is not intended to serve as a reference for making investment decisions.
You may also like
Will Zcash's ZEC return to $500 or higher before 2026?

Bitcoin's ‘bear flag pattern’ targets $67K as BTC spot demand slumps

Bitcoin Hash Ribbons flash ‘buy’ signal at $90K: Will BTC price rebound?

How to achieve an annualized return of 40% through arbitrage on Polymarket?
By demonstrating arbitrage structures with live trading, this provides a clear reference for the increasingly intense arbitrage competition in the current prediction markets.