

Date: Fri, Aug 22, 2025 | 11:50 AM GMT
The cryptocurrency market is facing notable volatility ahead of the Jackson Hole event, with both Bitcoin (BTC) and Ethereum (ETH) trading in the red with minor drop. This weakness has spilled into the altcoin market, where Sui (SUI) has come under pressure.
SUI has slipped 2.95% today, extending its weekly decline to 12%, and its chart now reveals a familiar bearish fractal setup that could hint at further downside.
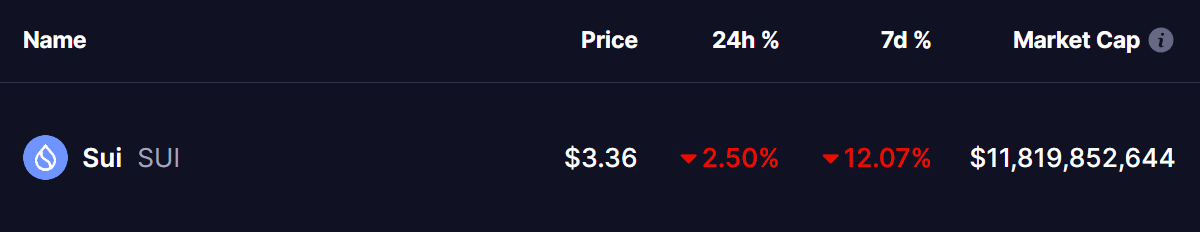 Source: Coinmarketcap
Familiar Pattern Hints at Further Drop
On the daily chart, SUI has been trading inside a broad rising wedge pattern — a structure that often signals waning bullish momentum and potential reversal pressure.
The price action shows an interesting fractal repetition. In a previous cycle, SUI rallied after a bullish crossover (blue circle), only to stall at the wedge’s upper boundary. From there, it broke below the 25-day moving average, slipped toward the 100-day MA (green circle), briefly consolidated, and then failed again (red circle). This led to a sharp 22% drop (yellow circle), sending the token down toward the wedge’s lower boundary.
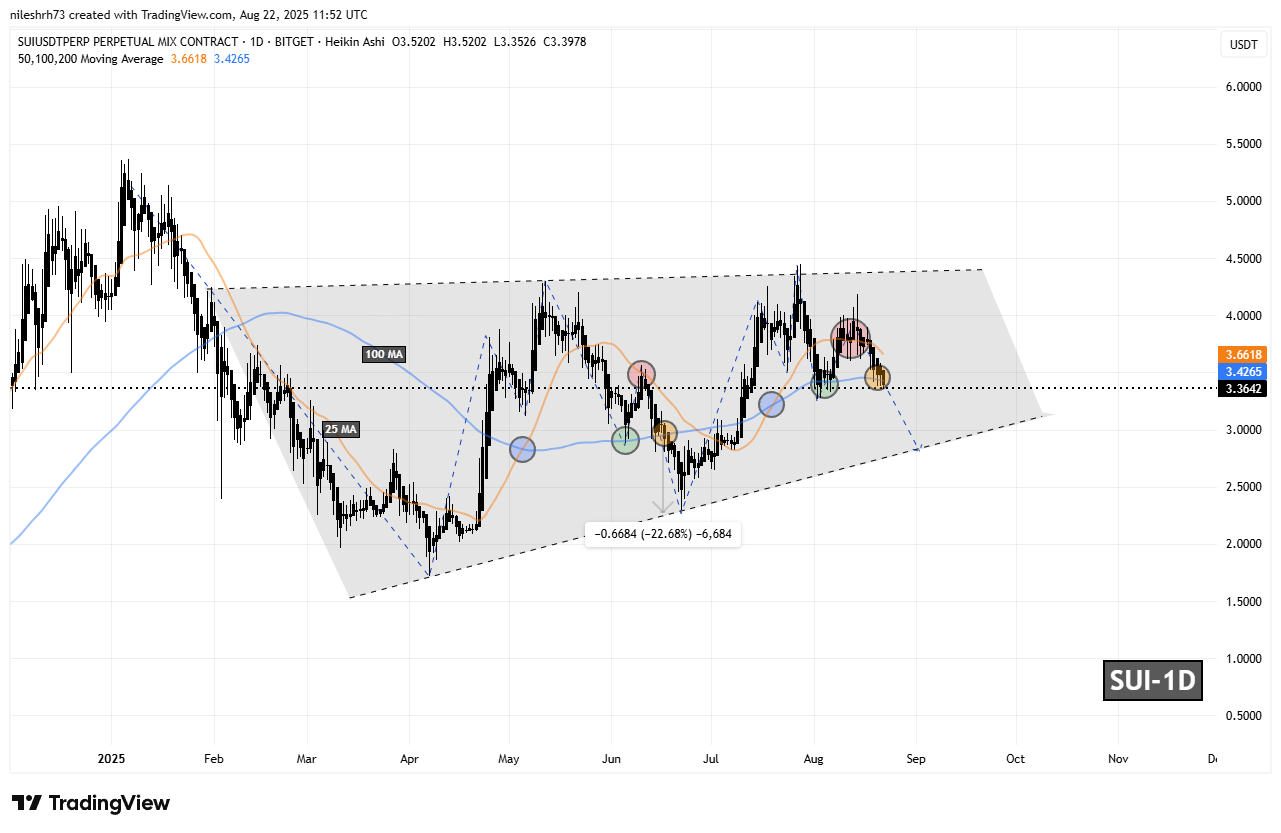 Sui (SUI) Daily Chart/Coinsprobe (Source: Tradingview)
Now, the pattern seems to be repeating.
SUI has once again failed to hold above its 25-day MA (red circle) and has recently broken down from the 100-day MA at $3.42, now trading slightly lower around $3.36. This setup mirrors the conditions seen before the last major decline.
What’s Next for SUI?
With the fractal breakdown already in play, the immediate path appears skewed to the downside. The next major support lies near the wedge’s lower boundary around $2.80, representing a potential 16% decline from current levels.
That said, much depends on Fed Chair Powell’s speech at the Jackson Hole event later today. A dovish stance could provide relief for risk assets, including SUI, and potentially fuel a rebound. Conversely, a hawkish signal may reinforce the bearish outlook and accelerate SUI’s decline.
A reclaim of the 100-day MA ($3.42) would be the first sign of invalidation of this bearish setup and could give bulls a chance to stabilize the trend.
Disclaimer: This article is for informational purposes only and not financial advice. Always conduct your own research before investing in cryptocurrencies.