Shiba Inu price has dropped below the mid-range level of $0.00001328 and is likely to test range support near $0.0000105. Short-term support sits at $0.00001184; a decisive break below $0.0000116 would signal further downside for SHIB.
-
SHIB dropped beneath the mid-range $0.00001328, increasing odds of a retest of $0.0000105.
-
Short-term support: $0.00001184; key warning level: $0.0000116.
-
Memecoin market cap fell ~18.8% in the past month; momentum indicators show mixed signals across timeframes.
Shiba Inu price analysis: SHIB drops below $0.00001328; watch $0.00001184 and $0.0000105 for trade setups. Read technical levels and trader actions.
What is driving the Shiba Inu price decline?
Shiba Inu price slipped under the mid-range $0.00001328 after failing to sustain a breakout. Low higher-timeframe trend strength, mixed momentum indicators and a broader memecoin market cap decline (about 18.8% in the past month) have pressured SHIB.
How are traders reacting to SHIB’s range-bound action?
Swing traders are focusing on clearly defined support and resistance. On the 1-day chart, swing points sit at $0.00001765 (resistance) and $0.00001028 (support). The CMF indicates buying pressure but remains below strong bullish thresholds, suggesting limited conviction.
Shiba Inu falls below the mid-range level – what next?
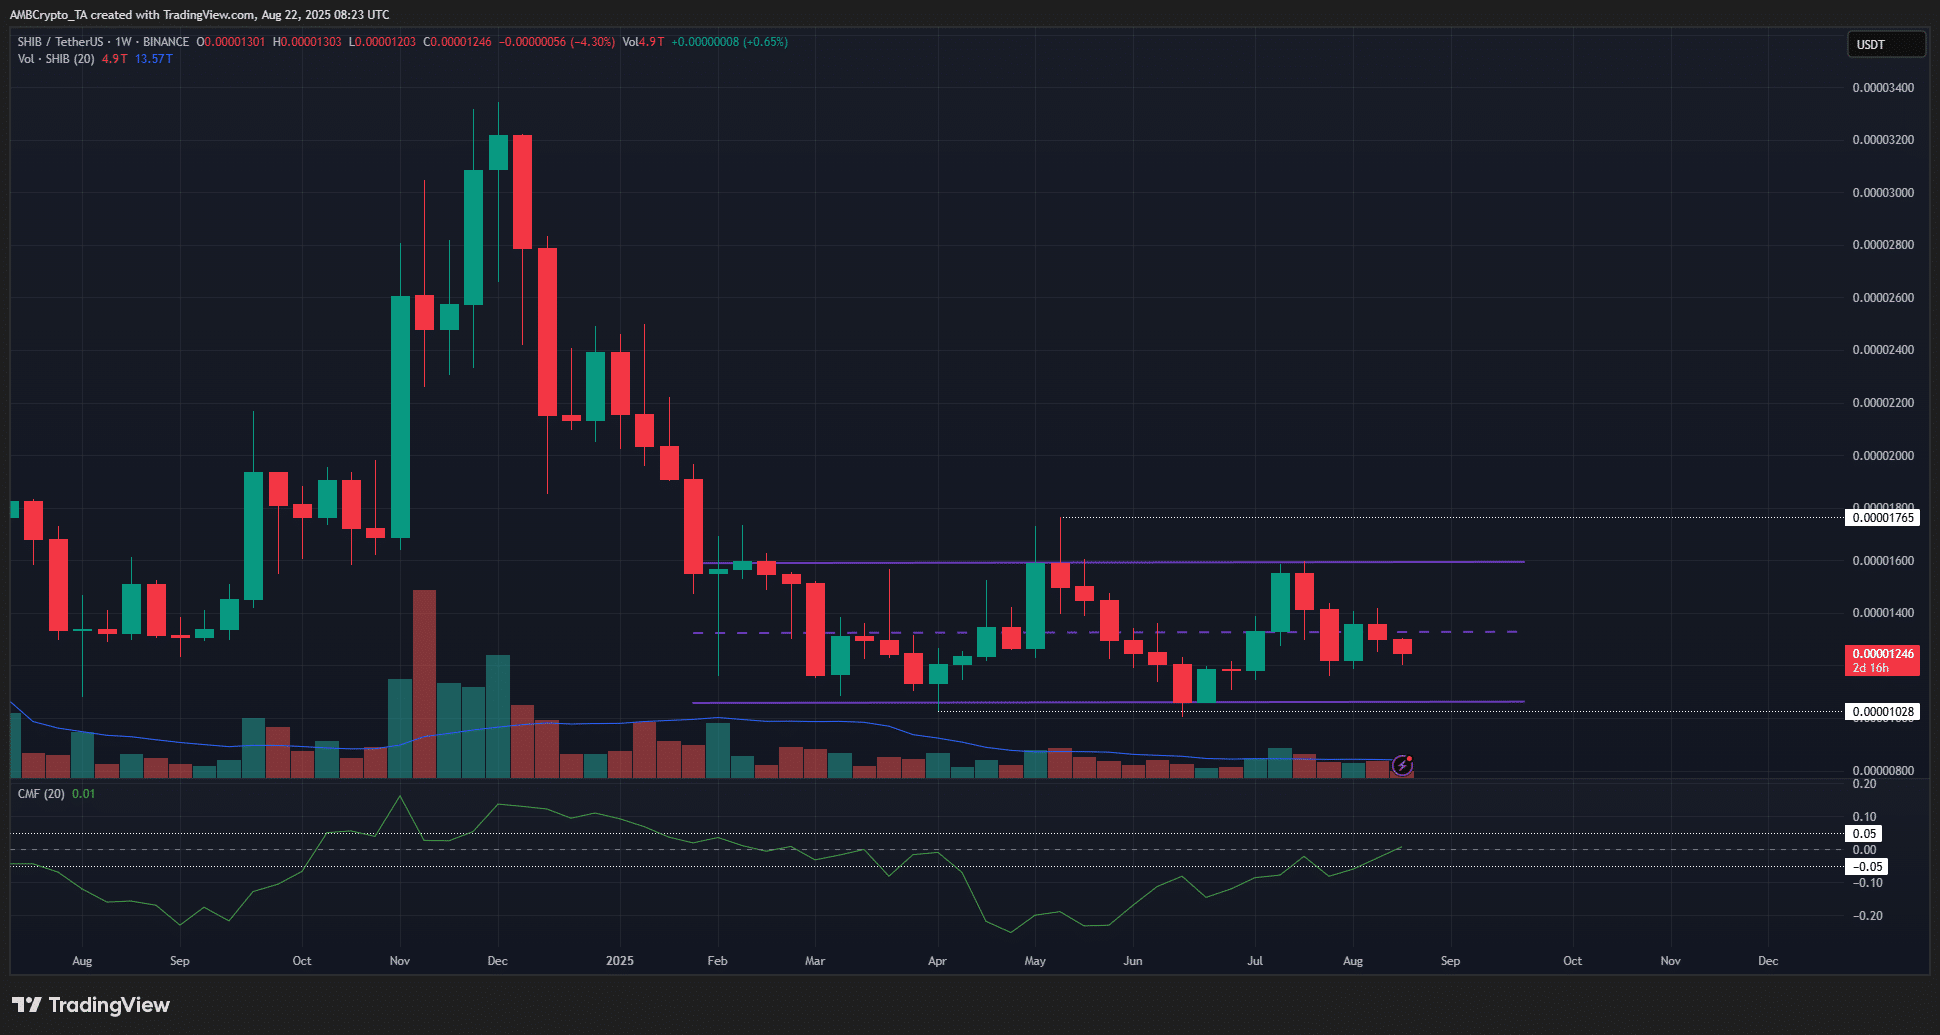
Source: SHIB/USDT on TradingView (price and chart references are shown for context)
Over the past six months SHIB traded in a wide range with no persistent higher-timeframe trend. Recent price action broke below the mid-range $0.00001328 and retested that level as resistance, increasing the probability of a move toward the lows of the range.
Daily swing points are identified at $0.00001765 (upper) and $0.00001028 (lower). The Chaikin Money Flow (CMF) shows modest buying pressure but remains below a strong bullish band, suggesting limited inflows on rallies.
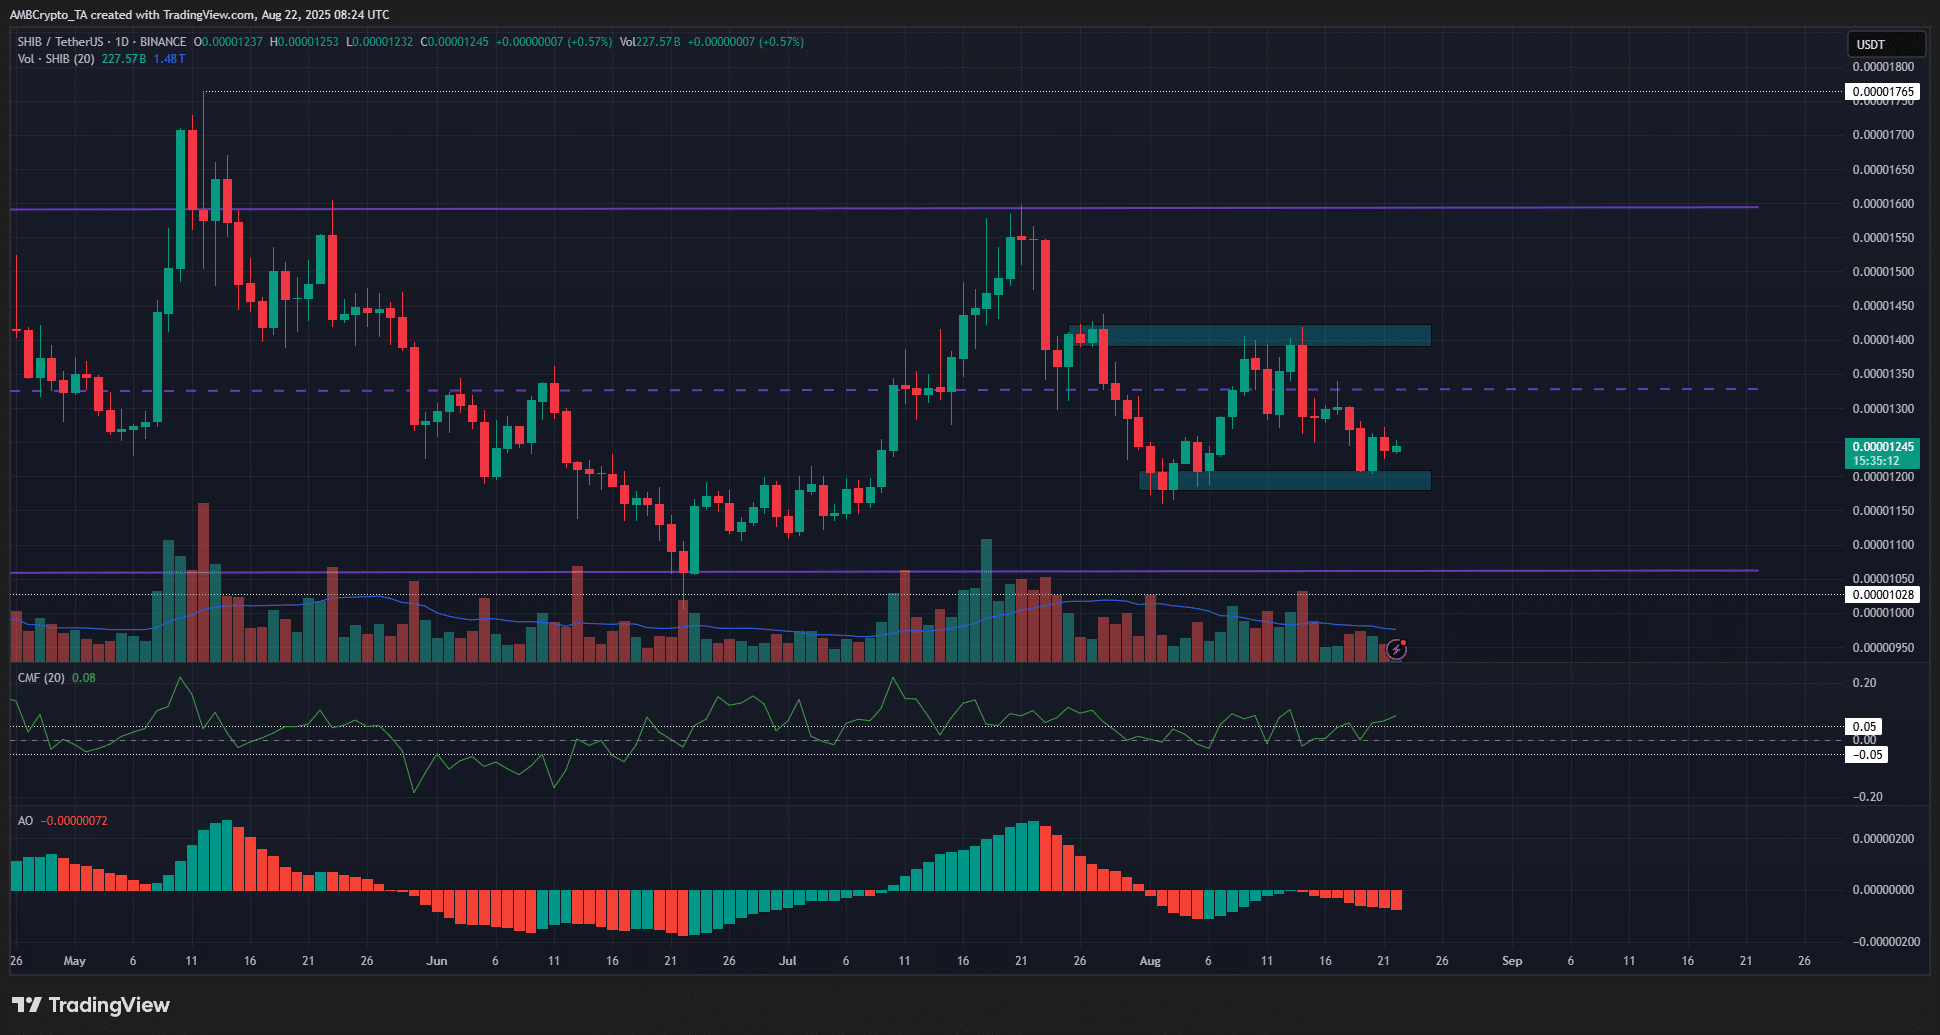
Source: SHIB/USDT on TradingView (technical indicators shown for analysis)
On the 4-hour timeframe, the Awesome Oscillator sits below zero (bearish momentum) while the CMF is above +0.05, indicating short-term capital inflow. Traders should treat $0.00001184 as immediate support and consider buying on confirmed retests with clear volume confirmation.
Risk management: a sustained break and close below $0.0000116 would signal weakening bull setups and is a recommended exit for long positions. A retest of $0.0000105–$0.00001028 constitutes a lower-risk buy zone if support holds and momentum indicators show divergence.
Frequently Asked Questions
What are SHIB’s immediate technical levels?
Immediate resistance: $0.00001328 (mid-range). Support cluster: $0.00001184 (near-term) and $0.0000105–$0.00001028 (range lows). Watch volume and CMF for conviction on tests.
How much did the memecoin market fall recently?
The memecoin sector’s market capitalization declined by approximately 18.8% over the past month, contributing to weaker sentiment for SHIB and peers.
When should traders close long SHIB positions?
Close longs if SHIB breaks and sustains below $0.0000116, or if momentum indicators confirm a bearish breakdown on increased volume.
Key Takeaways
- Mid-range breach: SHIB closed below $0.00001328, raising odds of a retest of $0.0000105.
- Watch support: $0.00001184 is immediate support; $0.0000116 is a key warning level for longs.
- Trade plan: Consider buys at confirmed support with stops under $0.0000116; manage size and monitor momentum indicators.
Conclusion
Shiba Inu remains range-bound with increased downside risk after falling under the $0.00001328 mid-range. Traders should front-load monitoring of $0.00001184 and $0.0000105, use volume and CMF for confirmation and apply disciplined risk management. COINOTAG will continue tracking SHIB price action and technical signals.
Disclaimer: The information presented does not constitute financial, investment, trading, or other types of advice and is solely the writer’s opinion.