Bitget App
Trade smarter
Buy cryptoMarketsTradeFuturesEarnWeb3SquareMore
Trade
Spot
Buy and sell crypto with ease
Margin
Amplify your capital and maximize fund efficiency
Onchain
Going Onchain, without going Onchain!
Convert
Zero fees, no slippage
Explore
Launchhub
Gain the edge early and start winning
Copy
Copy elite trader with one click
Bots
Simple, fast, and reliable AI trading bot
Trade
USDT-M Futures
Futures settled in USDT
USDC-M Futures
Futures settled in USDC
Coin-M Futures
Futures settled in cryptocurrencies
Explore
Futures guide
A beginner-to-advanced journey in futures trading
Futures promotions
Generous rewards await
Overview
A variety of products to grow your assets
Simple Earn
Deposit and withdraw anytime to earn flexible returns with zero risk
On-chain Earn
Earn profits daily without risking principal
Structured Earn
Robust financial innovation to navigate market swings
VIP and Wealth Management
Premium services for smart wealth management
Loans
Flexible borrowing with high fund security
BNB Tests $899 Resistance, $1,028 Target Possible if Momentum Holds

BNB Tests $899 Resistance, $1,028 Target Possible if Momentum Holds

CoinotagCoinotag2025/08/24 16:00
By:Sheila Belson

  • BNB resistance is at $899.24; a break signals a move to $1,028.84.

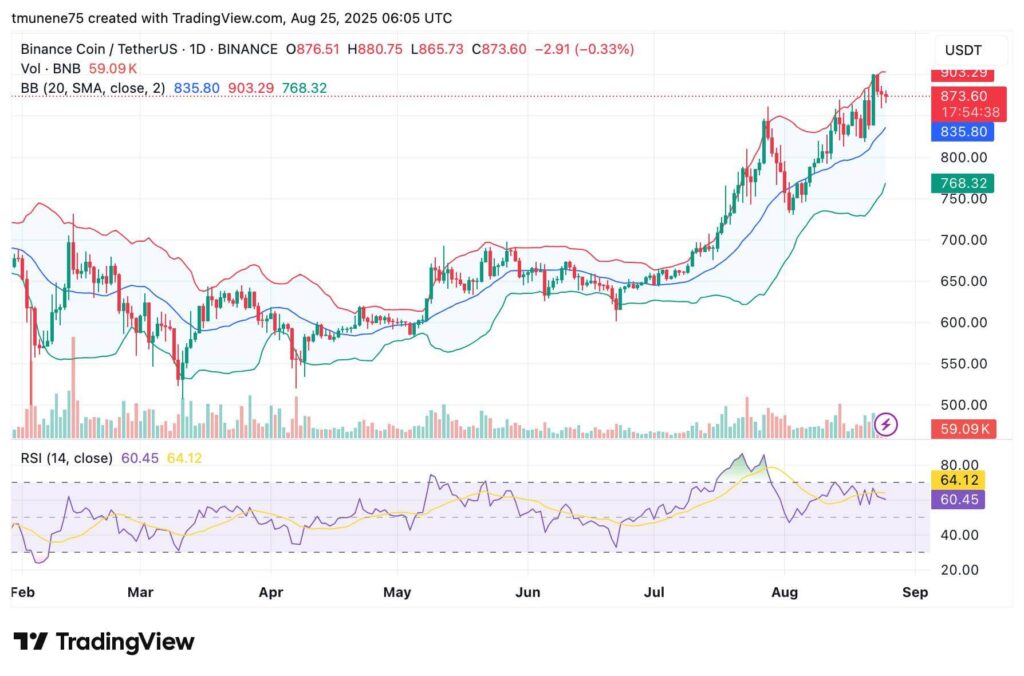
  • Support sits at $768.10; RSI 60.45 and upper Bollinger Band $903.29 indicate bullish bias.

  • Volume 59.09K confirms steady participation; long-term higher lows support the uptrend.

BNB resistance and price target update: BNB tests $899 resistance—watch $768 support and $1,028 target for the next move. Read the levels and indicators.

What is the current BNB resistance and price outlook?

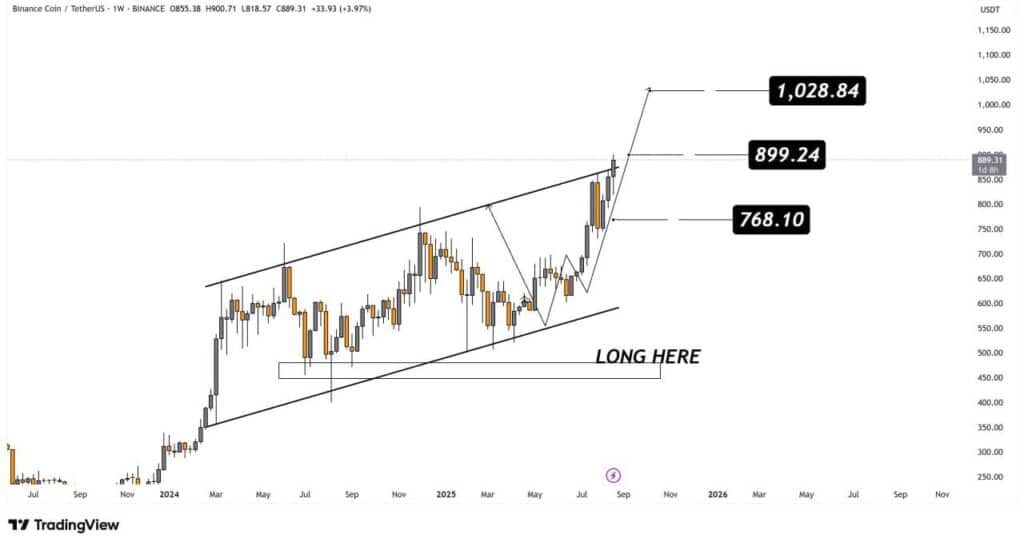
BNB resistance is currently concentrated at $899.24; holding above this level would support a rally toward the BNB price target of $1,028.84. Short-term support is at $768.10, and indicators show bullish momentum while caution is warranted near the upper Bollinger Band.

How has the ascending channel shaped BNB’s trend?

The ascending channel has produced consistent higher lows since early 2024, defining the bullish structure. Analysts observed consolidation around $500–$550 as accumulation, then a breakout that led to targets at $768 and $899 being met. Price action within the channel determines whether BNB resistance becomes new support.
BNB Tests $899 Resistance, $1,028 Target Possible if Momentum Holds image 0 BNB/USDT 1-week price chart, Source: Rose on X

How are support and resistance levels defined for BNB?

Support is marked at $768.10, the mid-channel reaction area where buyers re-entered during pullbacks. Immediate resistance is $899.24; surpassing that level sets the stage for the next BNB price target at $1,028.84. Failure to hold $768.10 risks a move back to the lower channel boundary.

What do technical indicators say about near-term momentum?

Bollinger Bands place the upper band at $903.29, the middle band at $835.80, and the lower band at $768.32, which shows price pressing the upper band but not yet extreme. RSI at 60.45 (below its 64.12 moving average) indicates room to run before overbought conditions. Trading volume of 59.09K signals healthy participation without exhaustion.

How to interpret BNB resistance in trading decisions?

Traders should treat BNB resistance at $899.24 as a decision point: a clean breakout with follow-through and volume supports a move to $1,028.84. If price rejects the level, look for re-entry near $835–$768 zones. Use stop placement below $768.10 to manage downside risk.


Frequently Asked Questions

What are the key BNB support and resistance levels to watch?

Key levels: support at $768.10 and immediate resistance at $899.24. A break above $899.24 targets $1,028.84; failure below $768.10 risks a return toward the channel lower boundary.

How likely is a move to $1,028.84 for BNB?

A move to $1,028.84 becomes likely if BNB closes above $899.24 with increased volume and sustained momentum, confirmed by RSI remaining elevated and price holding above the mid Bollinger Band at $835.80.

Key Takeaways

  • BNB resistance: $899.24 is the immediate decision point for bulls.
  • Support: $768.10 must hold to maintain the ascending channel and bullish trend.
  • Indicators: RSI 60.45 and Bollinger upper $903.29 show strength; volume is healthy at 59.09K.
BNB Tests $899 Resistance, $1,028 Target Possible if Momentum Holds image 1 BNB/USDT 1-day price chart, Source: TradingView

Conclusion

BNB resistance at $899.24 is the immediate market pivot; holding above it supports a run toward the BNB price target of $1,028.84. Monitor $768.10 as critical support and use indicators—RSI, Bollinger Bands, volume—to confirm breakouts. For traders, a structured plan with stops below $768.10 preserves capital while targeting upside continuation.

In Case You Missed It: Metaplanet's FTSE Japan Inclusion May Channel Passive Flows Into Bitcoin and Support BTC Floor Prices
0

Disclaimer: The content of this article solely reflects the author's opinion and does not represent the platform in any capacity. This article is not intended to serve as a reference for making investment decisions.

PoolX: Earn new token airdrops
Lock your assets and earn 10%+ APR
Lock now!

You may also like

Hyperliquid's Buybacks Fuel HYPE's Record Surge—But Will Upcoming Unlocks Derail Momentum?

- Hyperliquid’s HYPE token surged to an all-time high above $50, driven by record $357B derivatives volume in August. - The protocol’s buyback fund grew to $1.5B, reducing supply and boosting demand through automated token repurchases. - Analysts praise HYPE’s strong fundamentals but warn of valuation risks due to a $50B FDV and upcoming unlocks in November. - Emerging projects like MAGAX (meme-to-earn model) and Dogecoin’s 15% weekly gain highlight shifting crypto market dynamics.

ainvest2025/08/29 09:33
Hyperliquid's Buybacks Fuel HYPE's Record Surge—But Will Upcoming Unlocks Derail Momentum?

U.S. Economic Data Goes On-Chain as Blockchain Bridges Traditional and Digital Finance

- Chainlink partners with U.S. Commerce to deliver BEA macroeconomic data on-chain via 10 blockchain networks. - Pyth also selected for on-chain GDP data, advancing government blockchain transparency goals. - LINK surged 5% post-announcement, with analysts projecting $28-30 targets by September. - Integration enables DeFi applications like automated trading and tokenized government assets. - Chainlink's SEC engagement and $47+ long-term price forecasts highlight institutional adoption growth.

ainvest2025/08/29 09:33
U.S. Economic Data Goes On-Chain as Blockchain Bridges Traditional and Digital Finance

Tariffs to Checkout Aisles: Inflation’s New Supply Chain

- U.S. core PCE inflation is projected to rise to 2.9% in July, marking three consecutive monthly increases and the highest level since February. - Trump-era tariffs are cited as a key driver of rising goods prices, with costs flowing from ports to consumers through supply chain adjustments. - Services inflation shows upward momentum, complicating Fed policy as persistent price pressures could limit future rate-cut potential. - Markets anticipate an 88% chance of a September rate cut despite inflation rema

ainvest2025/08/29 09:33
Tariffs to Checkout Aisles: Inflation’s New Supply Chain

Bitcoin News Today: Bluemoon Joins Crypto Trend as Firms Hedge with Digital Assets

- Bluemoon Interactive spent $7.85M to buy BTC, ETH, and SOL in H1 2023 as part of its asset diversification strategy. - Shun Tai Holdings separately announced a HKD 70M crypto investment with strict risk controls including 10% transaction limits and 20% stop-loss thresholds. - The moves reflect growing corporate adoption of cryptocurrencies as macroeconomic hedges, with both firms targeting high-liquidity, established digital assets. - Hong Kong's recent virtual asset licensing framework signals regulator

ainvest2025/08/29 09:33
Bitcoin News Today: Bluemoon Joins Crypto Trend as Firms Hedge with Digital Assets