HBAR’s Month-Long Range May Snap—$0.20 Support in Jeopardy

HBAR’s month-long range faces mounting pressure as bearish sentiment grows. With $0.20 support in danger, the altcoin could see deeper losses unless new demand emerges.
Muted performance across the broader crypto market, fueled by steady profit-taking, has kept Hedera’s HBAR locked in consolidation since the beginning of August.
With traders waiting for a decisive catalyst to set the next direction, bearish signals are beginning to emerge. These suggest that HBAR may soon break below its narrow range.
Hedera Bears Target Key Support
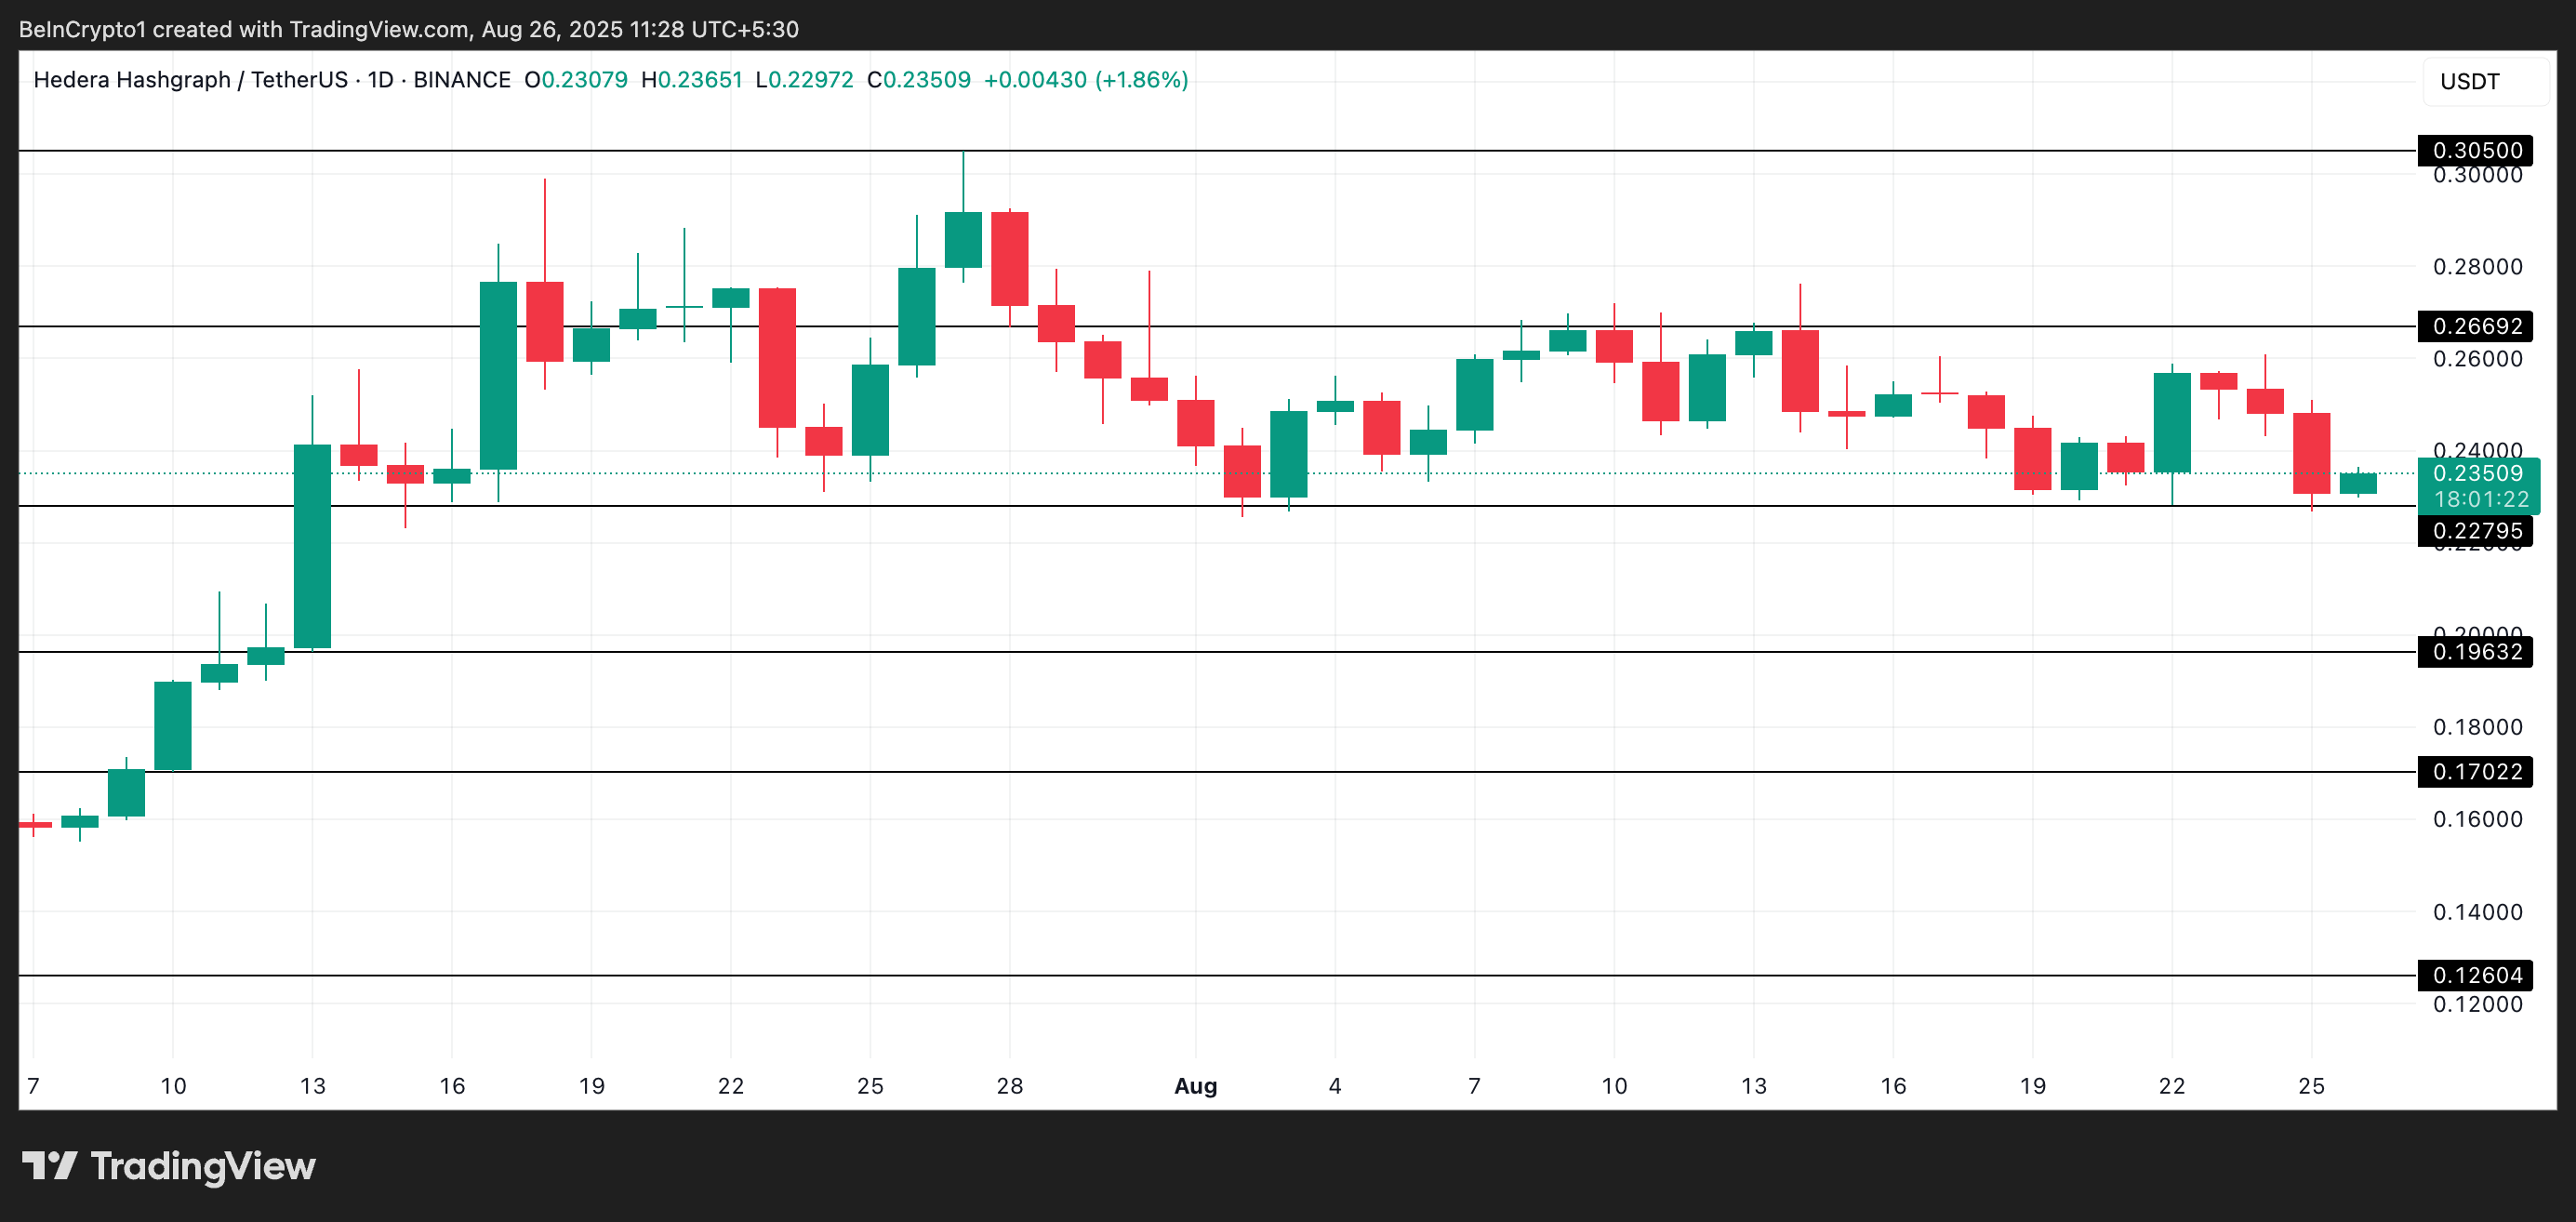
Readings from the HBAR/USD one-day chart show the altcoin trading within a horizontal channel. After July’s rally drove HBAR to a cycle peak of $0.30 on July 27, the token has since lost upward momentum and fallen into consolidation.
Since then, HBAR’s price action has moved mostly sideways, with a few unsuccessful attempts to break either above or below the channel. It has consistently faced resistance at $0.26 while holding support around $0.22, highlighting the market’s indecision.
For token TA and market updates: Want more token insights like this? Sign up for Editor Harsh Notariya’s Daily Crypto Newsletter .
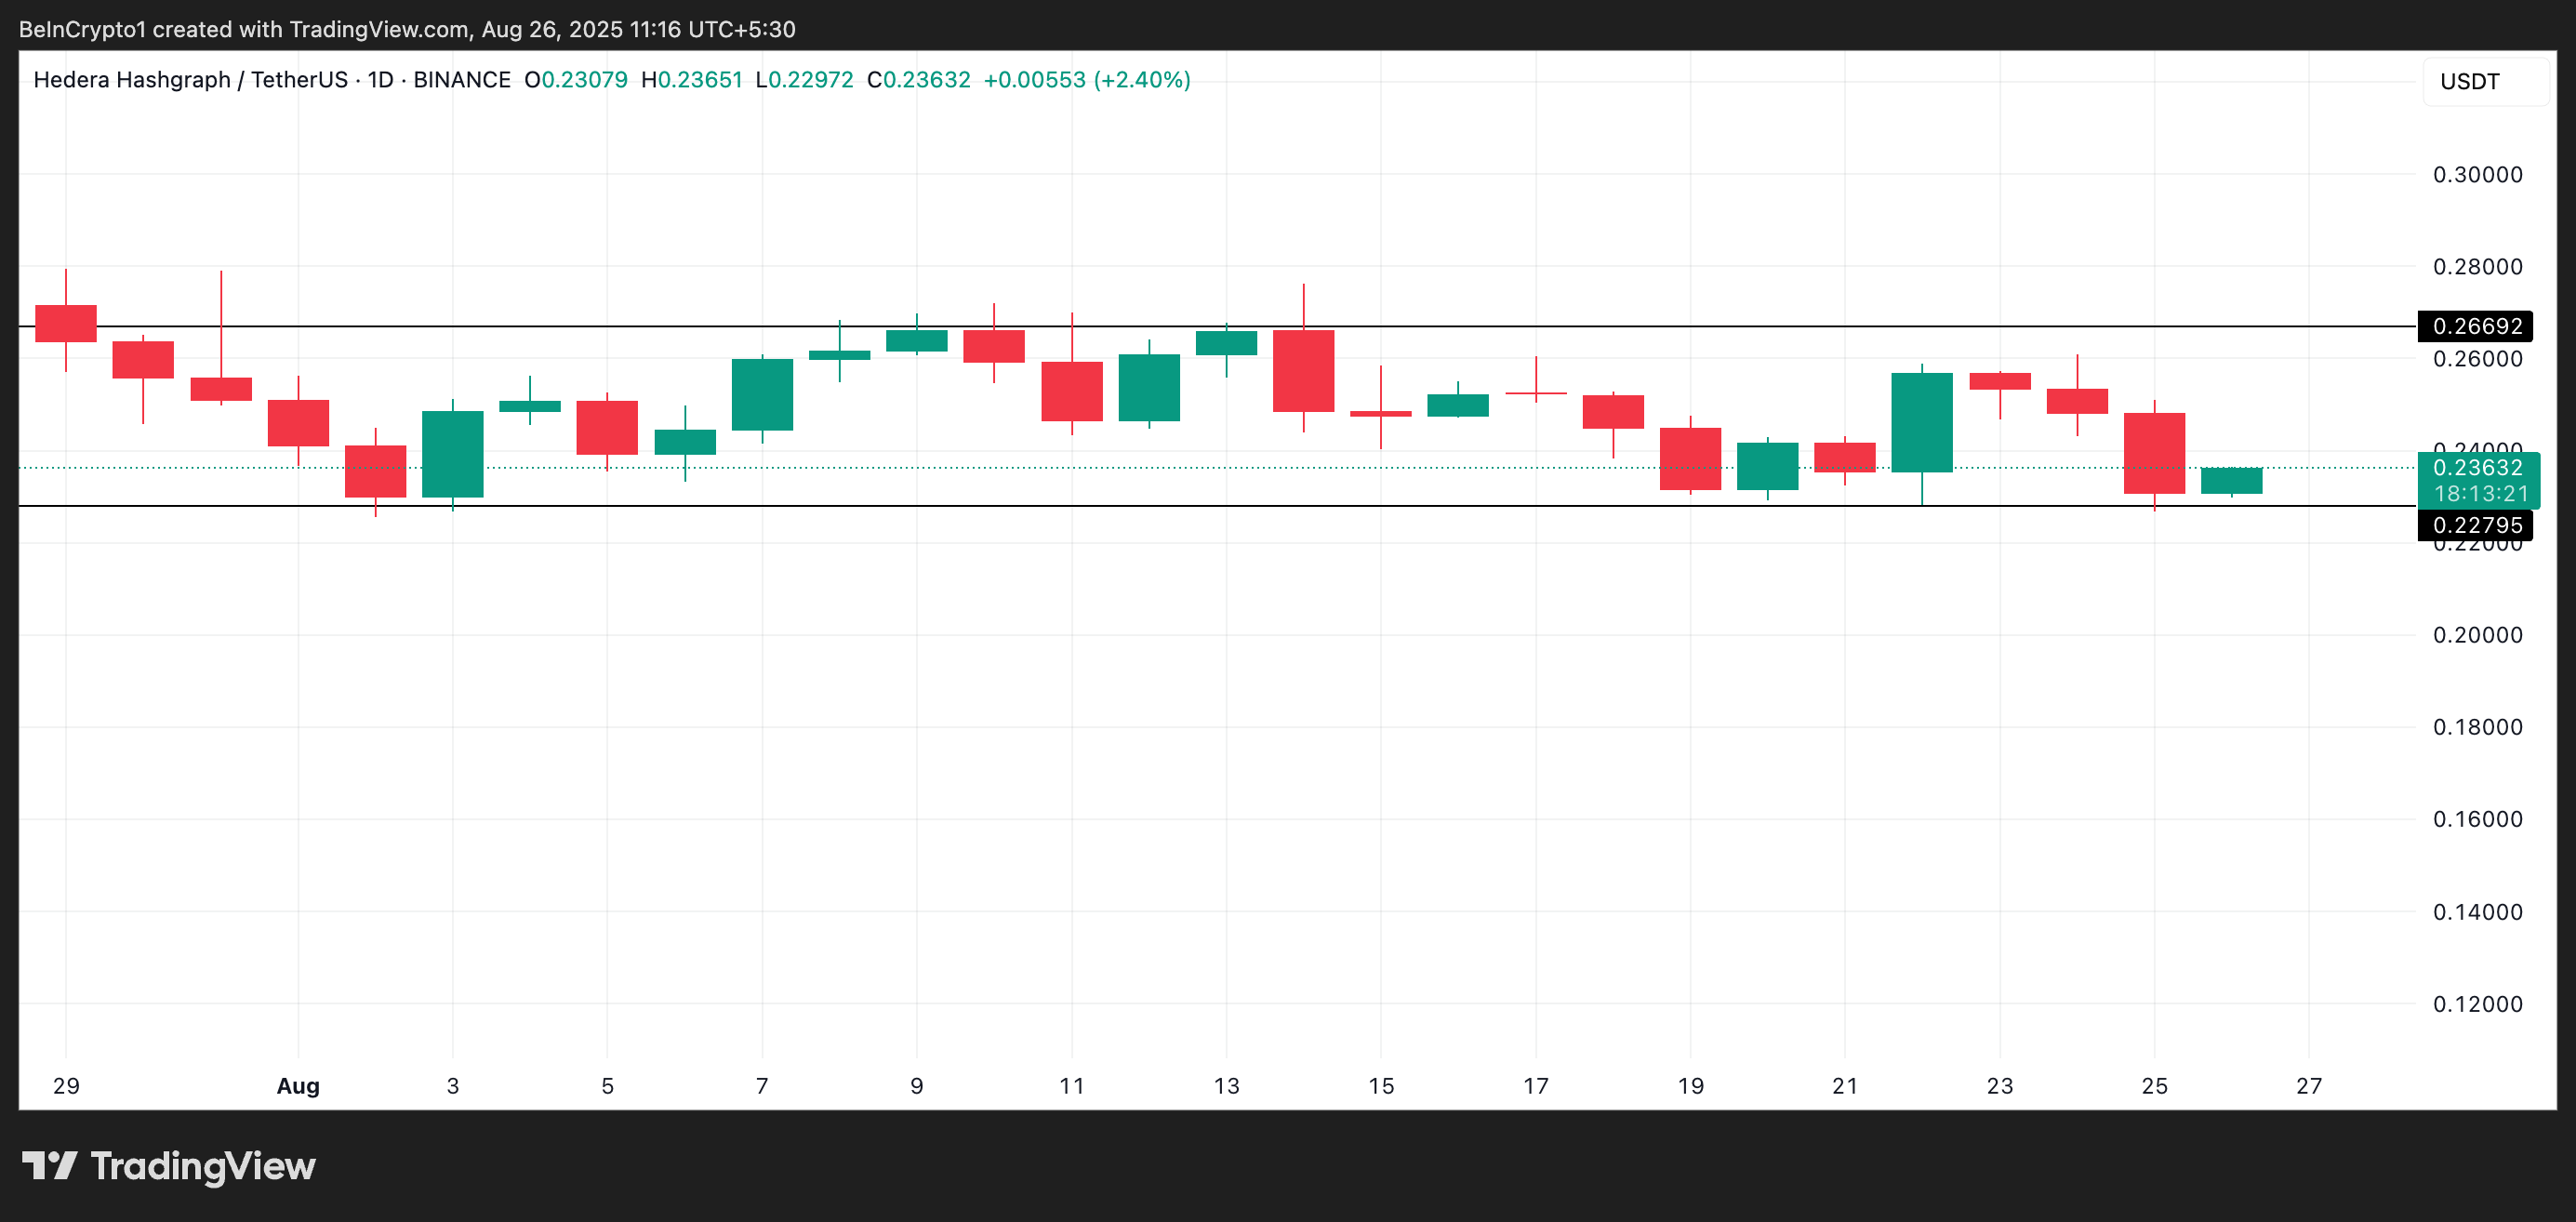 HBAR Horizontal Channel. Source:
TradingView
HBAR Horizontal Channel. Source:
TradingView
With on-chain and technical readings showing the bears gaining strength, HBAR may soon break below its $0.22 support level.
HBAR Futures Traders Bet on Breakdown
HBAR’s weighted funding rate has flipped negative for the first time in the past week, an indication that short positions are gaining traction and sell-side pressure is intensifying. As of this writing, it stands at -0.0016%.
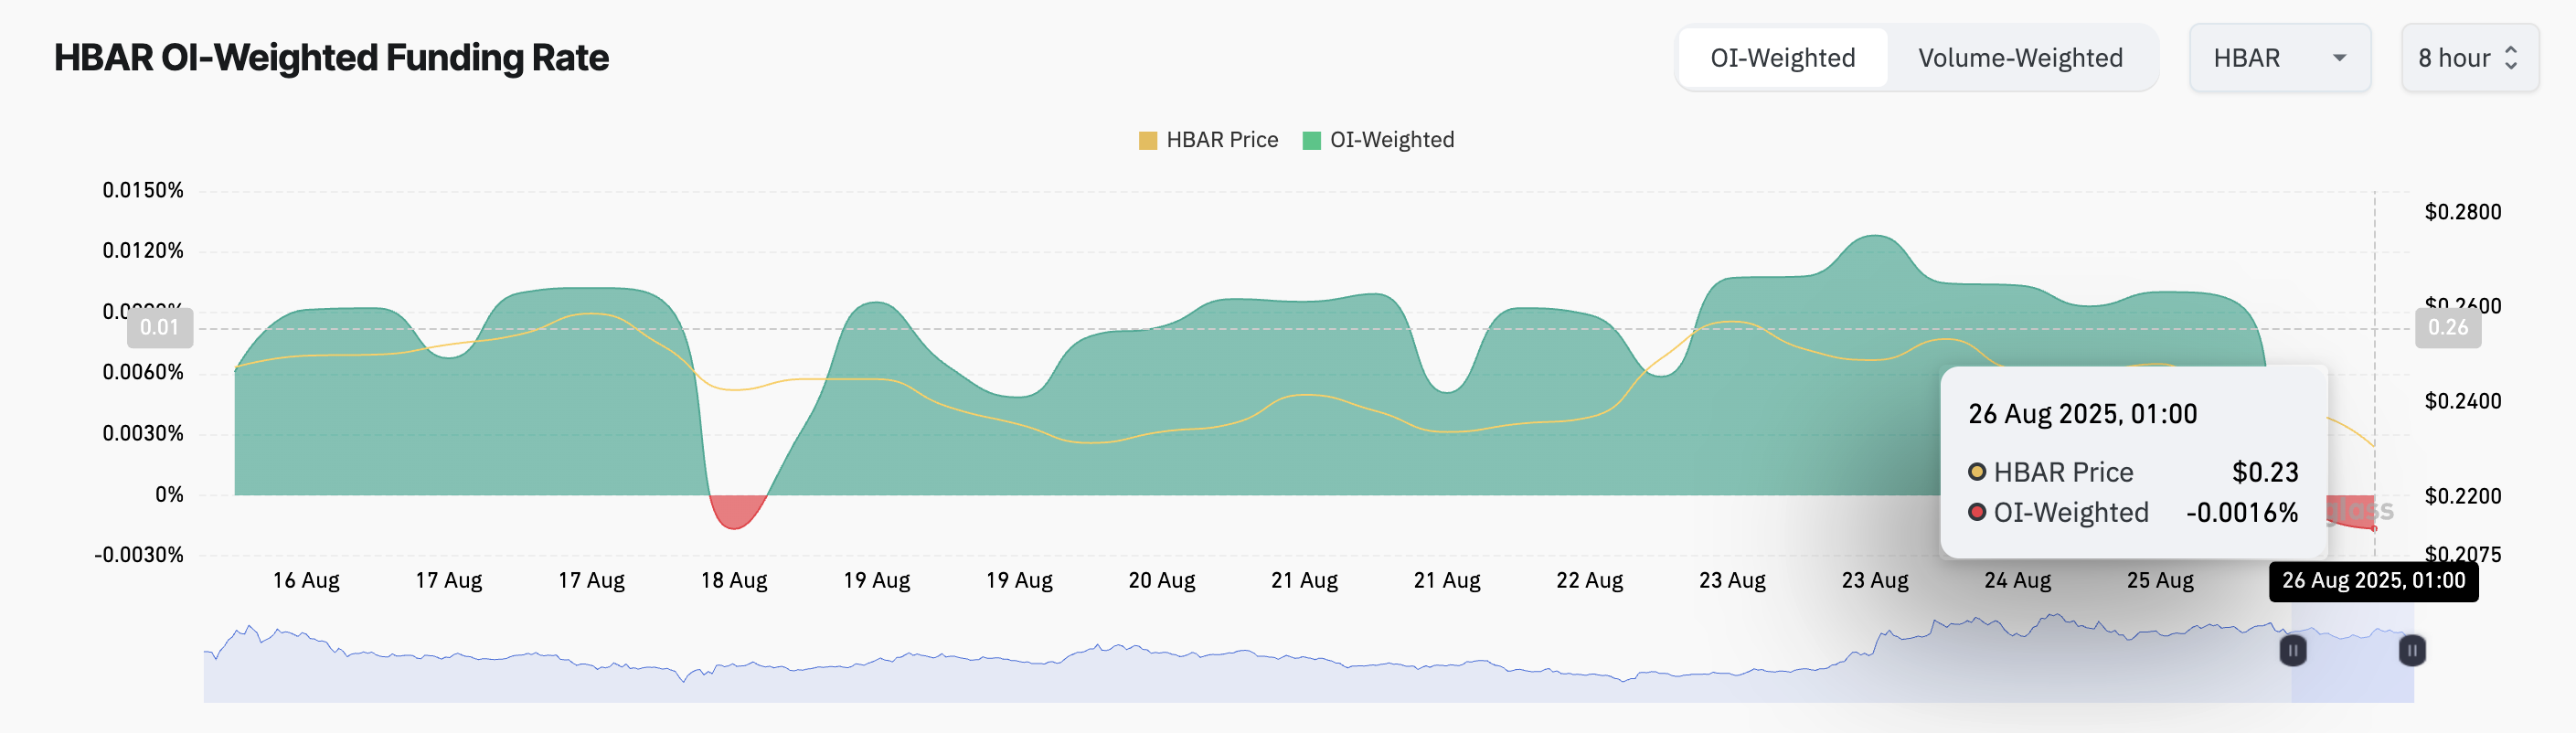 HBAR Funding Rate. Source:
Coinglass
HBAR Funding Rate. Source:
Coinglass
The funding rate is used in perpetual futures markets to keep contract prices aligned with the spot price. When an asset’s funding rate is positive, long traders are paying shorts, signaling bullish sentiment.
Conversely, a negative funding rate means short traders are paying longs, indicating that bearish bets dominate the market.
For HBAR, the negative flip in its funding rate shows that its futures traders are increasingly positioning for downside, worsening the risk of a breakdown below its current support zone.
Further, buy-side pressure from key traders has stalled, contributing to the downward pressure on HBAR. The token’s Smart Money Index (SMI), at 0.98 at press time, has plunged slowly since August 22, confirming that momentum is shifting in favor of the bears.
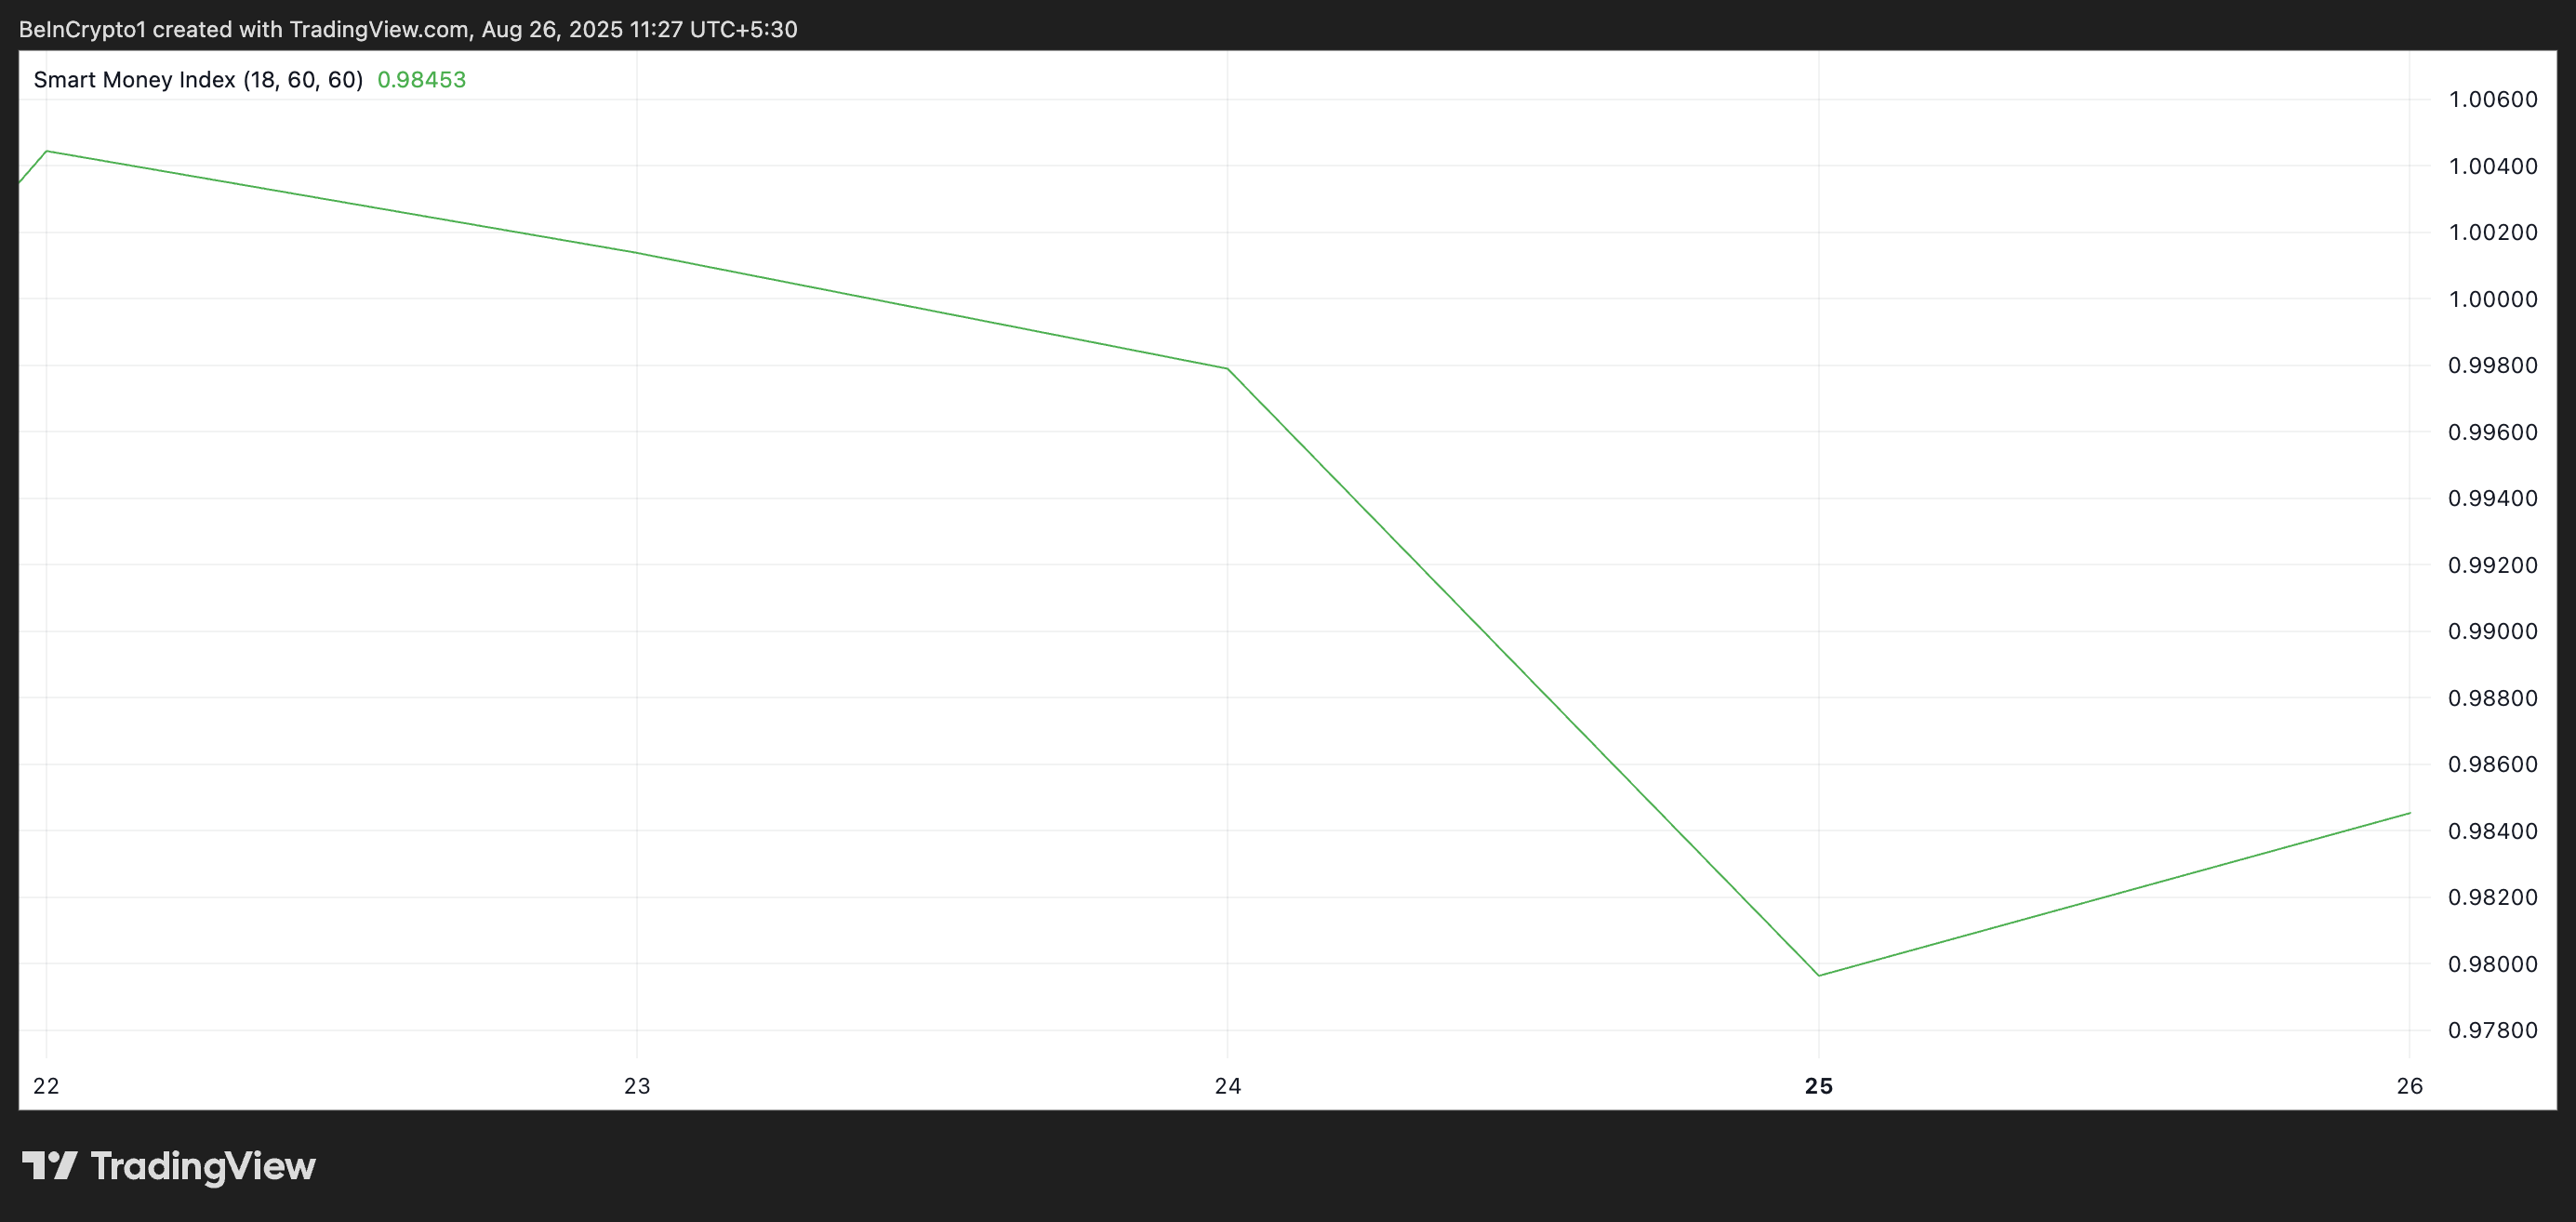 HBAR Smart Money Index. Source:
TradingView
HBAR Smart Money Index. Source:
TradingView
The SMI measures the activity of institutional investors by tracking price movements at specific times of the trading day. It reflects how “smart money” trades during the end-of-day sessions, after retail-driven volatility in the morning.
When the SMI spikes, it signals increased confidence from institutional investors, often indicating a bullish outlook.
On the other hand, when it drops, as with HBAR, these investors are less interested in holding their assets and are selling for profit. If this trend continues, it could exacerbate the downward push on HBAR’s price.
HBAR Bears Tighten Grip, But Bulls Still Eye $0.26 Breakout
If the weakness persists, HBAR’s price could fall below key support levels, opening the door to deeper losses. In this scenario, the altcoin could fall toward $0.22.
 HBAR Price Analysis. Source:
TradingView
HBAR Price Analysis. Source:
TradingView
However, if new demand emerges, HBAR could regain strength, break the $0.26 resistance, and head to $0.30.
Disclaimer: The content of this article solely reflects the author's opinion and does not represent the platform in any capacity. This article is not intended to serve as a reference for making investment decisions.
You may also like

In this bull market, even those who stand still will be eliminated: only "capital rotation" can survive the entire cycle.

Summary of the 7 deadly mistakes in the crypto market: 99% of traders keep repeating them

This Week's Preview: BTC Falls Below 94,000, AI "Judgment Day" and Macro "Settlement Day" Both Looming
Bitcoin and Ethereum prices have declined as the market adopts a risk-off approach ahead of the upcoming Nvidia earnings report and the release of the Federal Reserve minutes. Nvidia's earnings will influence the AI narrative and capital flows, while the Fed minutes may reinforce a hawkish stance. Summary generated by Mars AI. The accuracy and completeness of this summary are still being iteratively improved by the Mars AI model.