Cardano Price Prediction: Will ADA Break $1 or Crash Below $0.80?
Cardano (ADA) has been struggling to hold above the 0.85 level, and the daily chart shows a period of consolidation after a strong rally earlier this month. At the same time, global macroeconomic policies—both fiscal and monetary—are shaping aggregate demand, which directly influences risk assets like cryptocurrencies. The real question is: will these macro shifts provide a tailwind for ADA price , or is the market entering a correction phase.
How Aggregate Demand Links to Cardano’s Price
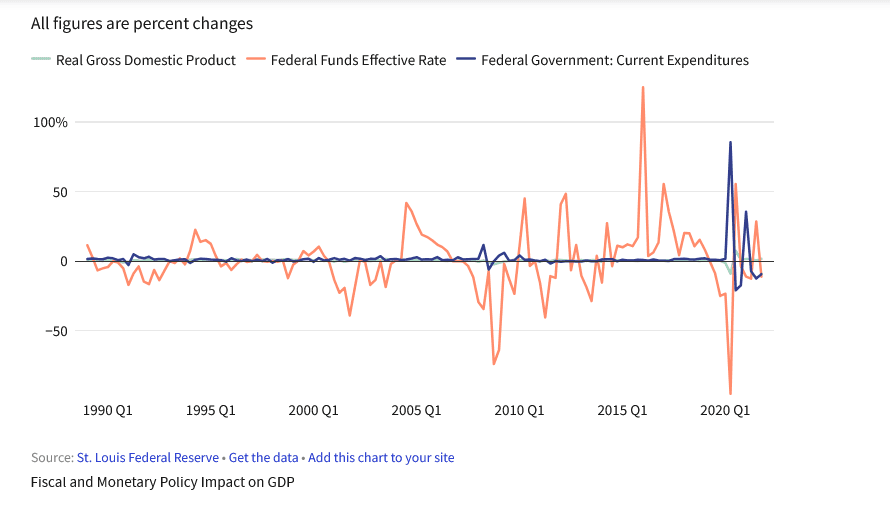
 Image Source: Investopedia
As reported , aggregate demand reflects the total demand for goods and services in an economy. It’s driven by consumer spending, investment, government expenditure, and net exports. When aggregate demand rises due to expansionary fiscal or monetary policy, risk assets like crypto generally benefit. More liquidity in the economy means higher risk appetite, and ADA often rides those cycles. Conversely, when central banks tighten monetary policy or governments scale back spending, liquidity drains from markets, weakening ADA’s upward momentum.
Expansionary fiscal policy , such as tax cuts or increased public spending, increases consumer purchasing power and indirectly drives inflows into speculative assets. Similarly, lower interest rates and easier credit from expansionary monetary policy make it cheaper to borrow and invest. On the other hand, contractionary measures, such as rate hikes or spending cuts, can choke demand and reduce ADA’s price support.
Cardano Price Prediction: ADA Daily Chart Breakdown
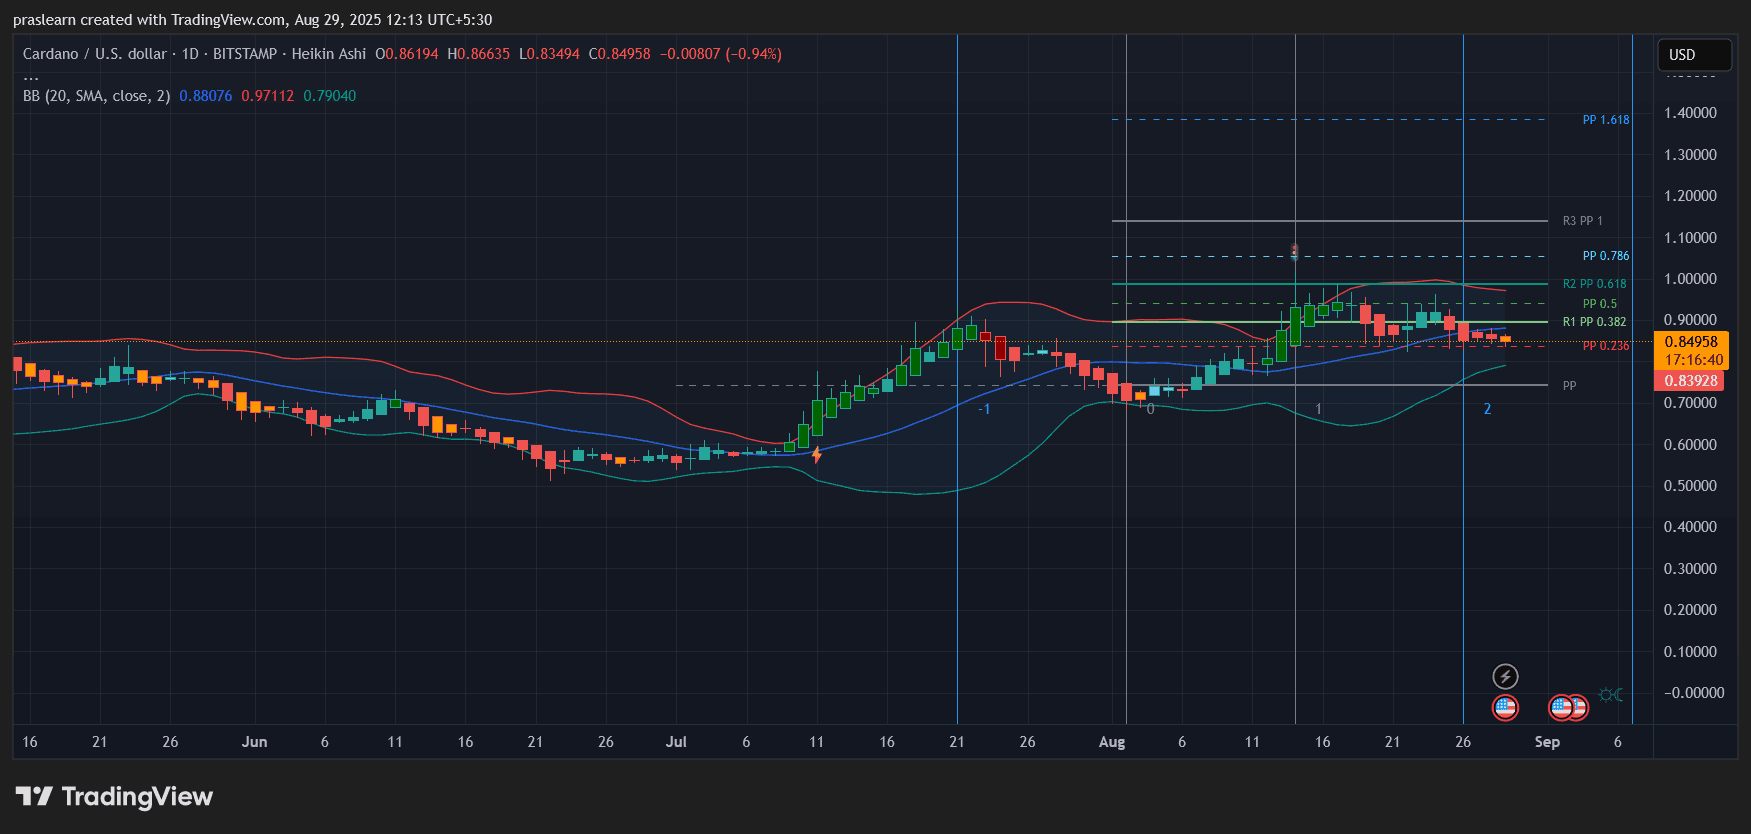
 ADA/USD Daily Chart- TradingView
Looking at the daily chart:
ADA price is trading at 0.85, right on the edge of the middle Bollinger Band, which sits near 0.88. This level is acting as immediate resistance.
The recent candles show indecision with multiple red Heikin Ashi prints, signaling fading bullish momentum after a strong July rally.
Fibonacci levels highlight 0.90 (0.382) and 1.00 (0.618) as upside resistance points if Cardano price regains strength. A break above 0.90 would open the door for another test toward 1.10.
On the downside, the 0.79–0.80 zone is strong support near the lower Bollinger Band. A breakdown below this could accelerate losses toward 0.70.
In short, ADA is consolidating within a narrow band. It’s in a make-or-break zone where macroeconomic conditions could decide its next leg.
Cardano Price Prediction: Will Fiscal and Monetary Policy Boost ADA Price?
If central banks lean toward expansionary monetary policy—cutting rates or easing liquidity—it will likely lift ADA price along with the broader crypto market. The extra liquidity would encourage speculative investment and help ADA retest the psychological 1.00 mark. Expansionary fiscal policy, such as infrastructure spending or tax cuts, would further fuel aggregate demand, indirectly benefiting ADA.
However, if policymakers shift toward contractionary policies to curb inflation, ADA may struggle to hold its ground. Higher interest rates increase the opportunity cost of holding non-yielding assets like crypto, while reduced government spending dampens liquidity, making ADA vulnerable to deeper pullbacks.
Short-Term Cardano Price Prediction
In the immediate term, ADA price is likely to oscillate between 0.80 and 0.90 while markets wait for policy signals. A breakout above 0.90 could confirm renewed bullish momentum, potentially targeting 1.10 in the coming weeks. If macroeconomic conditions remain favorable, Cardano price could even push toward 1.40 (the 1.618 Fibonacci extension).
But if aggregate demand contracts due to tighter monetary conditions, ADA risks slipping below 0.80, opening a path toward 0.70 and delaying any bullish breakout.
Cardano’s price right now is not only about chart resistance and support—it’s about aggregate demand in the global economy. Expansionary fiscal and monetary policies would provide a strong tailwind for $ADA, while contractionary moves could trigger more downside. Traders should watch both macroeconomic updates and ADA’s 0.80–0.90 range closely, as the next breakout direction will define $Cardano trajectory into September.
Disclaimer: The content of this article solely reflects the author's opinion and does not represent the platform in any capacity. This article is not intended to serve as a reference for making investment decisions.
You may also like
BEAT heats up, rallies 30%! A key level stands before Audiera’s ATH

Trending news
MoreBitget Daily Digest (Dec.22)|The U.S. House of Representatives Is Considering a Tax Safe Harbor for Stablecoins and Crypto Staking; Large Token Unlocks for H, XPL, SOON, and Others This Week; BTC RSI Near a 3-Year Low
Bitget US Stock Morning Brief | Fed Internal Divisions Widen; Trump Accelerates Space Militarization; Pharma Giants Accept Price Cuts for Tariff Relief (December 20, 2025)

