Chainlink’s On-Chain Metrics: A Tug-of-War Between Momentum and Correction Risks
- Chainlink (LINK) surged 70% YTD in August 2025, driven by institutional adoption and U.S. Commerce Department partnerships. - On-chain metrics show conflicting signals: 87.4% profit ratio near historical correction thresholds and negative Chaikin Money Flow indicate profit-taking risks. - NVT ratio mirrors 2024 bullish patterns suggesting undervaluation, but bearish divergence risks emerge if transaction volume stagnates. - Market dynamics remain fragile: 2.07M tokens moved to long-term storage, while as
The cryptocurrency market has long relied on on-chain data to decode the interplay between price action and network fundamentals. For Chainlink (LINK), a project central to decentralized oracle infrastructure, this dynamic is particularly instructive. As of August 2025, LINK has surged over 70% year-to-date, driven by institutional adoption and macroeconomic data partnerships, yet on-chain metrics suggest a fragile equilibrium between bullish momentum and looming profit-taking pressures.
The Dual Narrative: Strength and Weakness in On-Chain Signals
Chainlink’s price has broken through $25 in August 2025, fueled by a 38% monthly rally and a whale acquisition of 663,580 tokens for $16.85 million [4]. However, the Chainlink Reserve’s recent purchase of 41,000 tokens and the U.S. Department of Commerce’s integration of Chainlink Data Feeds for GDP and PCE metrics [1] mask a deeper tension in on-chain activity.
The Chaikin Money Flow (CMF) indicator, a gauge of buying pressure, turned negative on August 29, 2025, signaling waning institutional and retail participation [4]. Simultaneously, the profit ratio—the percentage of circulating supply in profit—hovered near 87.4%, close to its July peak of 97.5%, a level historically followed by corrections [2]. For context, a similar profit ratio in July 2025 led to a 19% price drop from $19.23 to $15.65 [2]. This suggests that while LINK’s fundamentals remain robust, technical exhaustion is building.
NVT Ratio: A Historical Mirror for Price Rallies
The Network Value to Transactions (NVT) ratio, a metric comparing market cap to transaction volume, offers further insight. As of August 2025, Chainlink’s NVT has returned to levels observed in November 2024, a period that preceded a 185% price surge from $10.56 to $29.26 [3]. This suggests the token may be undervalued relative to its utility, a pattern historically associated with strong upward momentum. However, the NVT’s current trajectory must be contextualized: a bearish divergence occurs when prices rise while NVT fails to follow, indicating weak utility adoption [3]. For now, the NVT Signal (NVTS) aligns with bullish historical patterns, but this could shift if transaction volume stagnates.
Institutional Adoption vs. Market Sentiment
Chainlink’s partnership with the U.S. Department of Commerce underscores its expanding role beyond DeFi, yet broader market conditions remain cautious. Bitcoin dominance has risen to 57.42%, reflecting a flight to safety amid altcoin underperformance [3]. This context complicates Chainlink’s prospects: while institutional interest in its oracle infrastructure is growing, the broader crypto market’s risk-off sentiment could amplify downside volatility.
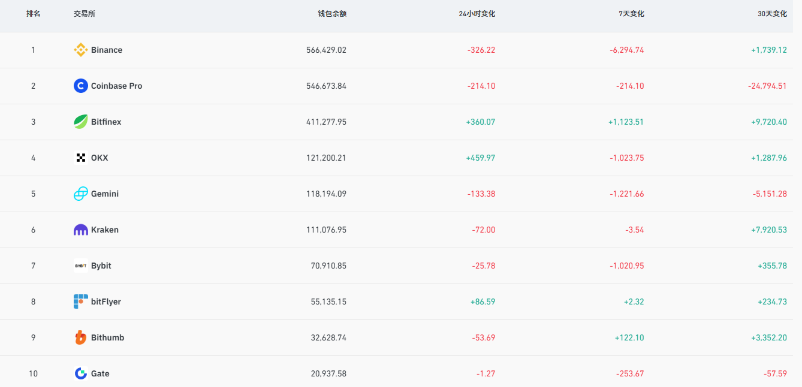
On-chain data reveals mixed signals. Over 2.07 million LINK tokens were withdrawn from exchanges in 48 hours, indicating a shift toward long-term storage [4]. Yet the ascending broadening wedge pattern on the daily chart—a structure often linked to waning upward momentum—suggests a potential breakdown below $22.84 could trigger a retest of $21.36 [2]. A sustained breakout above $27.88, however, would validate the year-long bullish trend and target $30–$34 resistance [4].
Conclusion: A Precarious Equilibrium
Chainlink’s on-chain metrics paint a nuanced picture. The NVT ratio and whale accumulation hint at undervaluation and institutional confidence, while weakening CMF and elevated profit ratios signal near-term correction risks. Investors must weigh these factors against the broader market’s risk-off environment. If the NVT pattern from 2024 repeats, LINK could retest $29.26 [3]. However, a breakdown below $22.84 would expose deeper vulnerabilities, particularly if Bitcoin dominance continues to rise.
In the end, Chainlink’s trajectory will hinge on whether its expanding utility in government and enterprise sectors can offset the fragility of its on-chain momentum. For now, the data suggests a high-stakes balancing act—one that demands close attention to both technical and fundamental signals.
Disclaimer: The content of this article solely reflects the author's opinion and does not represent the platform in any capacity. This article is not intended to serve as a reference for making investment decisions.
You may also like
Tether financial analysis: Needs an additional $4.5 billion in reserves to maintain stability
If a stricter and fully punitive approach is applied to $BTC, the capital shortfall could range from 1.25 billion to 2.5 billion USD.
The fundraising flywheel has stalled, and crypto treasury companies are losing their ability to buy the dip.
Although the treasury companies appear to have ample resources, the disappearance of stock price premiums has cut off their financing channels, causing them to lose their ability to buy the dip.

Nearly 10,000 bitcoins withdrawn from exchanges, is the market about to change direction?