
Bitcoin Price Stabilizes – Is This the Start of a Comeback?

Bitcoin price is still showing bearish signs below $112,000. BTC is now attempting to recover and might face hurdles near the $110,500 level.
- Bitcoin started a fresh decline below the $112,000 zone.
- The price is trading below $110,500 and the 100 hourly Simple moving average.
- There was a break above a short-term contracting triangle with resistance at $108,800 on the hourly chart of the BTC/USD pair (data feed from Kraken).
- The pair might start another decline if it stays below the $110,500 zone.
Bitcoin Price Starts Consolidation
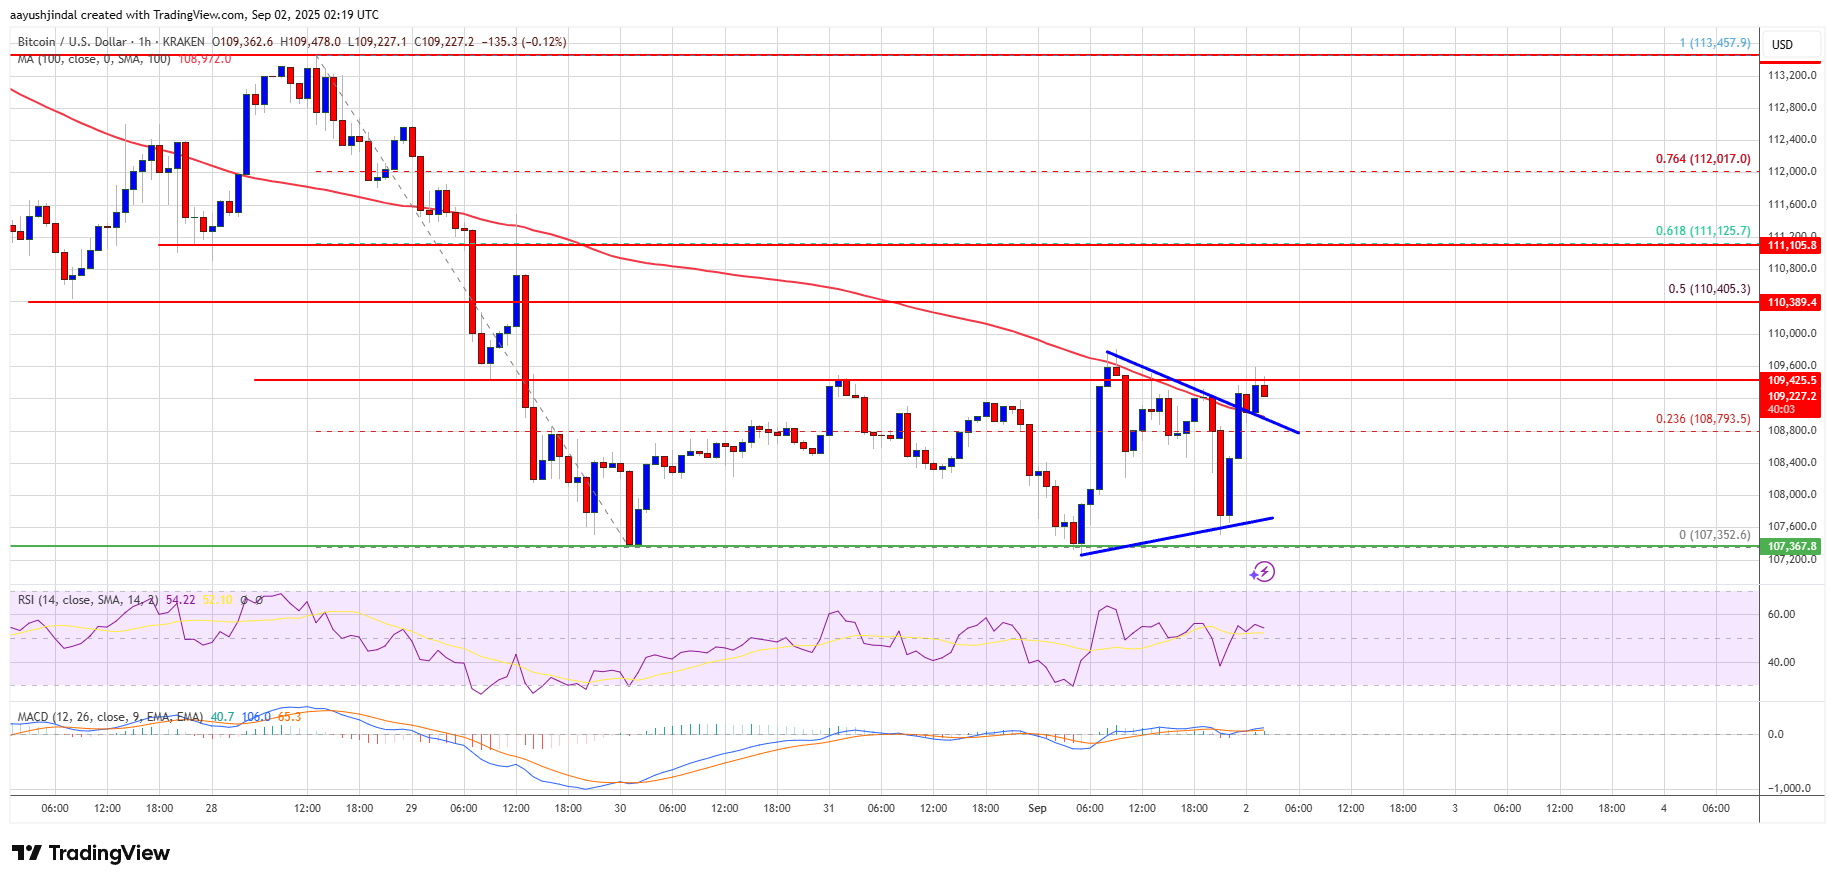
Bitcoin price attempted a fresh recovery wave from the $107,350 zone. BTC was able to climb above the $108,200 and $108,400 resistance levels.
The price cleared the 23.6% Fib retracement level of the key drop from the $113,457 swing high to the $107,352 low. Besides, there was a break above a short-term contracting triangle with resistance at $108,800 on the hourly chart of the BTC/USD pair.
However, the bears are still active near $109,500. The price is now consolidating near $109,500. Bitcoin is now trading below $110,000 and the 100 hourly Simple moving average.
Immediate resistance on the upside is near the $109,500 level. The first key resistance is near the $110,200 level. The next resistance could be $110,500 or the 50% Fib retracement level of the key drop from the $113,457 swing high to the $107,352 low.
A close above the $110,500 resistance might send the price further higher. In the stated case, the price could rise and test the $111,650 resistance level. Any more gains might send the price toward the $112,500 level. The main target could be $113,500.
Another Decline In BTC?
If Bitcoin fails to rise above the $110,500 resistance zone, it could start a fresh decline. Immediate support is near the $108,800 level. The first major support is near the $108,200 level.
The next support is now near the $107,350 zone. Any more losses might send the price toward the $106,500 support in the near term. The main support sits at $105,500, below which BTC might decline sharply.
Technical indicators:
Hourly MACD – The MACD is now losing pace in the bearish zone.
Hourly RSI (Relative Strength Index) – The RSI for BTC/USD is now above the 50 level.
Major Support Levels – $108,800, followed by $108,000.
Major Resistance Levels – $109,500 and $110,500.
Disclaimer: The content of this article solely reflects the author's opinion and does not represent the platform in any capacity. This article is not intended to serve as a reference for making investment decisions.
You may also like
Historic Fundraising: Real Finance Attracts $29 Million to Revolutionize RWAs

Bold Bitcoin OG Doubles Down: Expands Massive ETH Long Position to $392 Million
Bitcoin Price Plummets: Key Factors Behind the Sudden Drop Below $91,000