Interest Rate Cuts and Liquidity Shift: How to Position Risk Assets for the “Roaring Twenties”?

The high volatility brought by the price surge, combined with bullish narratives, will boost market confidence, expand risk appetite, and ultimately lead to frenzy.
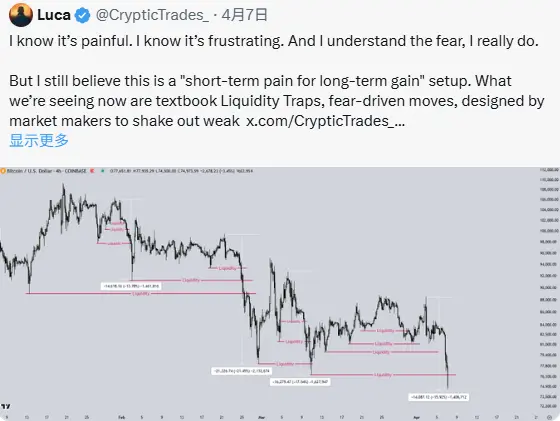
Author: Luca
Translation: Tim, PANews
Parabolic Peak → Decline → The Roaring Twenties
Note: The "Roaring Twenties" refers to the social and cultural developments in Europe and America during the 1920s, especially in music and popular culture.
Market Outlook for the Coming Months
First, please allow me to introduce my background.
August 5, 2024, September 2024, April 2025—these moments of sharp decline have all tested my conviction, but I have continued to accumulate positions in anticipation of higher prices.
Why? Because I know this bull market will ultimately end with a massive "parabolic top," a peak that will trigger FOMO in everyone before the actual top arrives.
My entire analytical framework is built around sentiment reversal, that is, a rapid shift from uncertainty and anxiety to extreme excitement.
Crypto market makers are well-versed in how to exploit retail sentiment.
The high volatility brought by price surges, combined with bullish narratives, will boost market confidence, expand risk appetite, and ultimately create a frenzy.
I believe this is exactly how market makers will use the bull market environment in the coming weeks and months to distribute their holdings.
An obvious example of market makers treating retail investors as counterparties can be traced back to early 2025.
At that time, we tracked liquidity traps through on-chain data and price movements, and many signs indicated that market makers were preparing for a bigger move.
Although most people thought this rally was over, our analysis showed that it was only just beginning.
At that time, I publicly stated that my cash position was at its lowest since the bear market bottom in 2022, because I believed it was an excellent buying opportunity, which turned out to be true.
Then, BTC and the entire market bottomed out. You might think the liquidity traps and market manipulation would disappear, right?
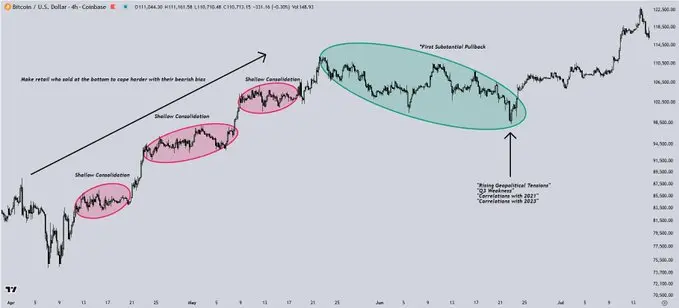
But this time, BTC's reversal was highly unusual. The price did not experience any substantial pullback but instead surged almost vertically from early April to the end of May, heading straight for new all-time highs.
Along the way, we only saw simple shakeout signals. This market behavior had only one purpose: to trigger FOMO in those who sold at the bottom and make them look for re-entry opportunities.
Every brief pause on the candlestick chart was treated as a "resistance test."
When the first comprehensive pullback finally arrived, most market participants were already stuck in a bearish mindset and began actively seeking confirmation.
Sure enough, the "certainty" news arrived:
- Escalating geopolitical tensions
- Typical Q3 weakness
- Similar price action to 2021
- Similar price action to 2023
This led many to believe the market was about to enter a prolonged consolidation phase, so they hedged before the next round of all-time highs.
"Okay, Luca, but how is all this connected?" you might ask.
Well, I think we need to understand how we got here before we can grasp the upcoming trends. The market reveals its patterns over a long period, and everything we've experienced so far is the main basis for predicting the future.
I believe all these liquidity traps, consolidation phases, and bearish sentiment have played and will continue to play a key role. Together, they contribute to and ultimately drive the sentiment reversal that takes us to the cycle top.
Again, if sentiment reversal is a rapid shift from uncertainty to full-blown euphoria, then market makers must first create the opposite conditions.
They need to push most people toward bearishness and panic in a low-liquidity environment, then drive prices higher, which ultimately lays the foundation for distribution.
So, what should we expect next?
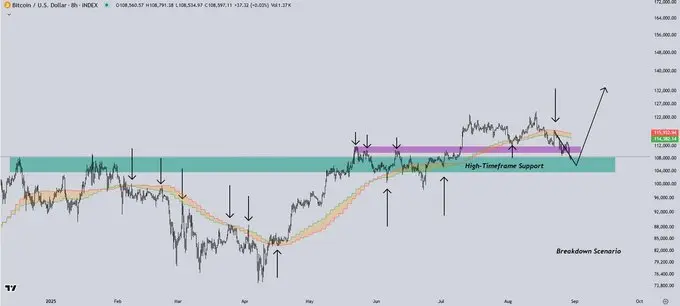
From a technical perspective, I believe the most likely scenario for BTC in the coming days is that the price will bottom out between the highs of November and December 2024, a range that makes the risk-reward ratio favor buyers in the mid-to-short term.
According to my strategy, I have gradually rotated funds from bitcoin and overvalued altcoins back into altcoins.
From a narrative and sentiment perspective—factors I always like to consider—this analysis actually makes perfect sense.
It convinces the market that a major pullback is imminent, and the "weak September" pattern further reinforces this expectation. I anticipate this narrative will dominate market sentiment in the coming days.
This situation may prompt many traders to hedge or short before the next major rebound, which is why the current market structure makes so much sense to me and why I remain optimistic in the medium term.
"Okay, Luca, I understand the concept of 'sentiment reversal.' Essentially, it means price volatility triggers emotional polarization and a reversal, but how does this affect the distribution phase and the cycle top?" you might wonder.
This is where the certainty bias comes in. Investors naturally look for narratives that support their arguments and ignore contrary evidence, especially when the market is volatile.
This is exactly what we saw from bears in late June this year. They were convinced a long consolidation phase was coming, ignoring two key realities: we are in a post-halving year, and the overall bullish market structure remains intact.
This is where macro policy comes into play: the end of quantitative tightening, a shift toward rate cuts, and the possibility of a soft economic landing.
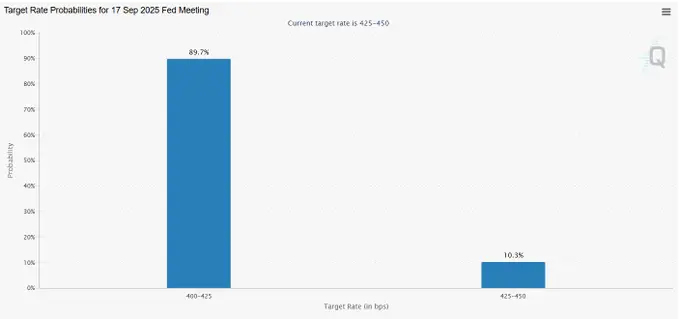
First, if we look at the FedWatch tool on CME, it currently shows about a 90% probability of a rate cut in September.
Looking back at the S&P 500's price action over the past 30 years, the pattern is clear: the last three times the Fed stopped quantitative tightening and started cutting rates, it was followed by a recession and a massive market crash.
This pattern has occurred 100% of the time in the past 30 years.
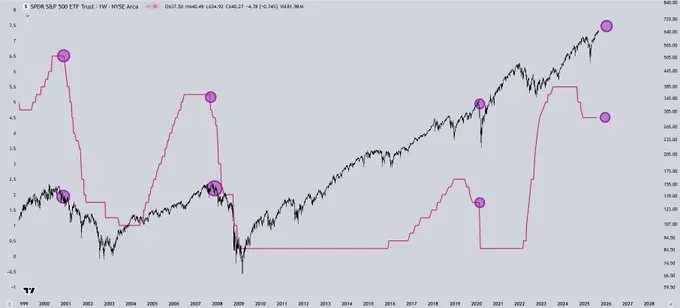
This is because the Fed never intervenes for no reason. Whether it's raising rates to curb runaway inflation or cutting rates to stimulate a weak economy, Fed intervention always means one thing: the current economic trajectory is unsustainable and must be changed.
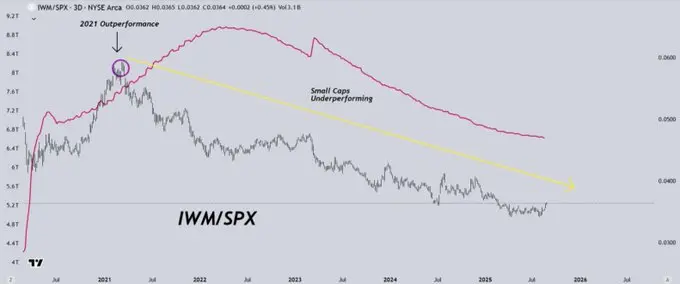
Here is a very compelling chart: the IWM/SPX ratio.
This shows the performance of small-cap stocks relative to traditional S&P 500 stocks over the past few years, essentially reflecting how risk assets perform compared to safer, more mature assets.
Since the Fed began withdrawing from quantitative easing in 2021, IWM (Russell 2000 Index) has consistently underperformed SPX (S&P 500 Index). I believe there are reasonable explanations for this, mainly two factors:
Small caps need cheap capital:
- Their business models rely on aggressive expansion, which requires low-cost financing. With rates high and capital expensive, many companies have had to dilute equity to survive, and their stock prices reflect this pressure.
Risk appetite collapse:
- Most small caps are still in early stages or cannot sustain profitability. In a high-rate, uncertain environment, investors have been unwilling to take on this risk. They prefer the relative safety of large-cap and mega-cap tech stocks.
- This is why small-cap stocks have underperformed the S&P 500 in recent years.
But interestingly: I think we are approaching a turning point.
- The Fed is preparing to exit quantitative tightening and gradually shift back toward stimulus.
- If this shift materializes, it could be the macro catalyst that reverses the downtrend in small caps and truly brings capital back to risk assets.
The latest macroeconomic data also supports this environment and the narrative of a soft landing in the coming weeks and months.
GDP grew 3.3% year-on-year, while Q1 data was revised downward. Personal income rose 0.4% month-on-month, and personal spending rose 0.5% month-on-month.
I think these two numbers are key because they tell us how much "fuel" consumers have left.
Income growth shows household incomes are rising, while spending growth tells us how much money is actually flowing into the economy.
I believe the economic balance looks healthy at this point: incomes are rising, consumers are still spending, and this supports growth.
What does this mean for traditional markets and the S&P 500?
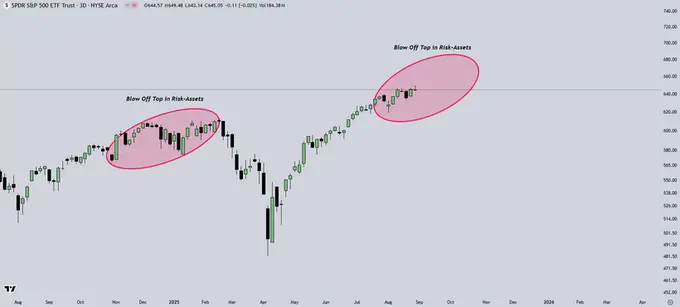
Looking back at October to December 2024, we witnessed a blow-off top in risk assets, and the subsequent distribution intensified the sell-off in early 2025.
I think we are now preparing for a similar situation, only on a larger scale. The upcoming rate cuts, rising risk appetite, and discussions about ending quantitative tightening and adding new liquidity are all driving buying.
In my view, this is not the start of a new sustainable uptrend. Instead, it looks more like another distribution phase, which I expect will ultimately create a much larger final top, after which the market will enter a bear cycle.
That said, I believe there is still upside in the medium term.
I believe that in the coming weeks, we will fully enter a risk-on market environment. This will likely push FOMO sentiment to its peak, creating the perfect opportunity for market makers to distribute their holdings.
It is worth remembering that the distribution phase often occurs after risk appetite heats up, and this risk appetite is usually driven by bullish sentiment. In the medium term, this dynamic will continue to support risk assets.
Because I anticipate market volatility and the potential washout of recent late buyers, I have maintained a substantial cash position. Over the past few days, I have been gradually rebuilding risk positions in preparation for the next rally.
For me, holding cash means having the power to decide: when bearish signals appear, I can hedge to reduce short-term downside risk; when good risk-reward opportunities arise, I can quickly adjust my portfolio.
Meanwhile, I am also preparing for the other direction of the cycle. As we move deeper into this phase, I plan to gradually shift from risk assets to more defensive sectors, such as consumer staples, healthcare, and government bonds. Since the market has been chasing growth and momentum, these sectors have lagged behind.
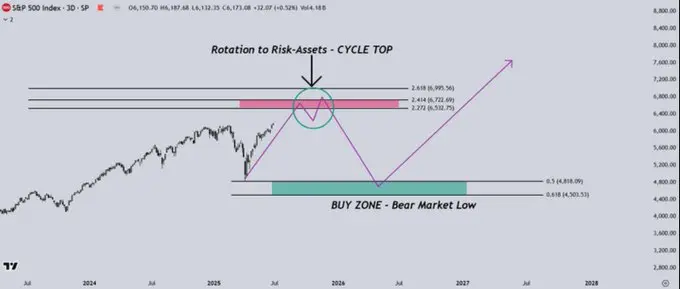
Looking ahead, my target for the S&P 500 is around the 6500 to 6700 range, after which the market will enter a prolonged distribution phase and the economy will eventually slip into recession.
After that, I plan to diversify my portfolio until the market experiences a major pullback and we get through the bear market.
This will give me the opportunity to re-enter at lower levels and position for the next quantitative easing cycle, in which I believe stocks and high-risk assets will once again perform exceptionally well.
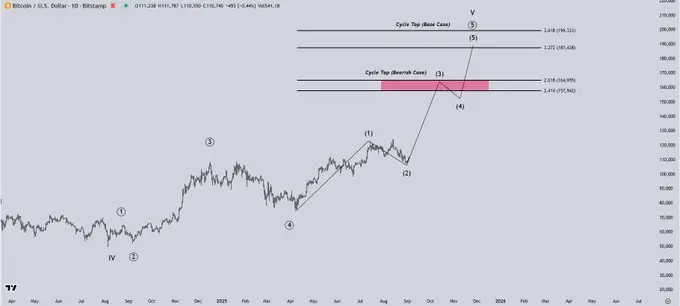
For BTC, my current base case is that the cycle high will be around $190,000 before the bear market begins.
I also see a more bearish scenario where bitcoin tops out near $150,000.
There is also a bullish scenario—the so-called "supercycle"—but I am not considering that for now.
In my view, this narrative is more likely to appear during the frenzy at the very top of the market, rather than being based on current realities.
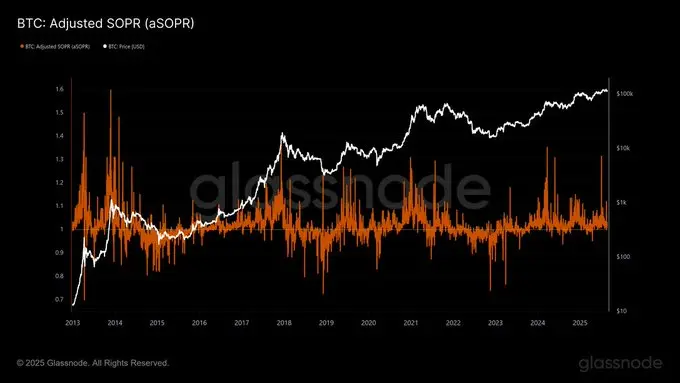
Looking at a key GlassNode metric, the adjusted SOPR (aSOPR), which measures the number of bitcoins sold at a profit, I believe it can provide us with valuable insights into the cycle stage.
At previous cycle tops, we usually saw multiple spikes in this indicator, which typically meant massive distribution. So far, we have only seen one major spike.
One reason I think altcoins will perform so well is that this usually happens when bitcoin is not in a full distribution phase.
The last time we saw multiple sharp swings in aSOPR was in March 2024, during the altcoin boom, when many altcoins hit cycle highs.
I believe that once we see several more such spikes, the risk-reward structure will favor altcoins, and this will also signal that bitcoin and the entire crypto market are approaching the cycle top.
This will be a key indicator I will be watching closely.
So, where does the concept of the "Roaring Twenties" fit into all this?
I believe the macroeconomic backdrop is crucial. We are heading into a high-inflation environment, and the Fed is preparing to shift from quantitative tightening to quantitative easing.
This backdrop is strikingly similar to the 1920s, a decade also characterized by runaway inflation and a surge in productivity driven by the Industrial Revolution.
Today, the driving force is the artificial intelligence revolution.
As an entrepreneur, I can say: AI really changes everything.
What once required a team of dozens can now be replaced by a small group of people who know how to maximize AI.
From a historical perspective, leaps in productivity drive rapid economic growth. Add high inflation, cheap credit, and abundant liquidity, and you can see the whole picture.
The next few years will be amazing for the stock market and other risk assets, but I also believe it will lead to the largest wealth gap in history.
Disclaimer: The content of this article solely reflects the author's opinion and does not represent the platform in any capacity. This article is not intended to serve as a reference for making investment decisions.
You may also like
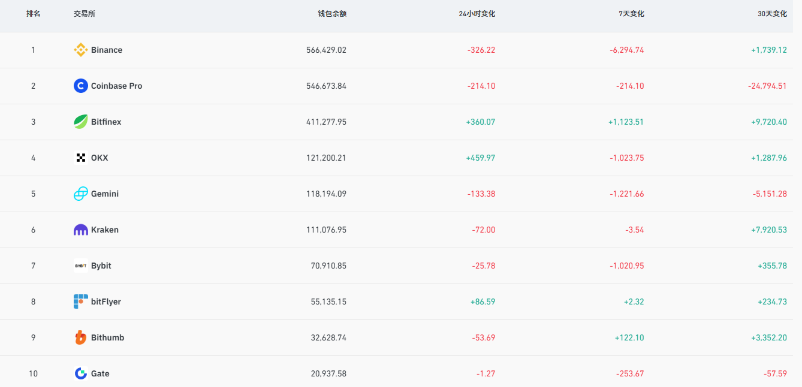
Nearly 10,000 bitcoins withdrawn from exchanges, is the market about to change direction?

Bitcoin ’rallies are for selling‘: Top 3 arguments from BTC market bears

XRP bulls grow louder: What will spark the breakout toward $2.65?