XRP Price Action Heats Up – Bulls Eye $3.00 Breakout

XRP price is up over 5% and has tested the $3.00 resistance. The price is now consolidating gains and might correct lower if stays below $3.00.
- XRP price is facing hurdles and struggling to clear the $3.00 resistance.
- The price is now trading above $2.90 and the 100-hourly Simple Moving Average.
- There is a bullish trend line forming with support at $2.930 on the hourly chart of the XRP/USD pair (data source from Kraken).
- The pair could continue to rise if it stays above the $2.860 zone.
XRP Price Gains Traction
XRP price managed to stay above the $2.850 level and started a fresh increase, beating Bitcoin and Ethereum. The price climbed above the $2.880 and $2.90 resistance levels.
The bulls even pumped the price above the $2.950 level. A high was formed at $2.994 and the price is now consolidating gains. It is testing the 23.6% Fib retracement level of the upward move from the $2.794 swing low to the $2.994 high.
The price is now trading above $2.920 and the 100-hourly Simple Moving Average. Besides, there is a bullish trend line forming with support at $2.930 on the hourly chart of the XRP/USD pair.
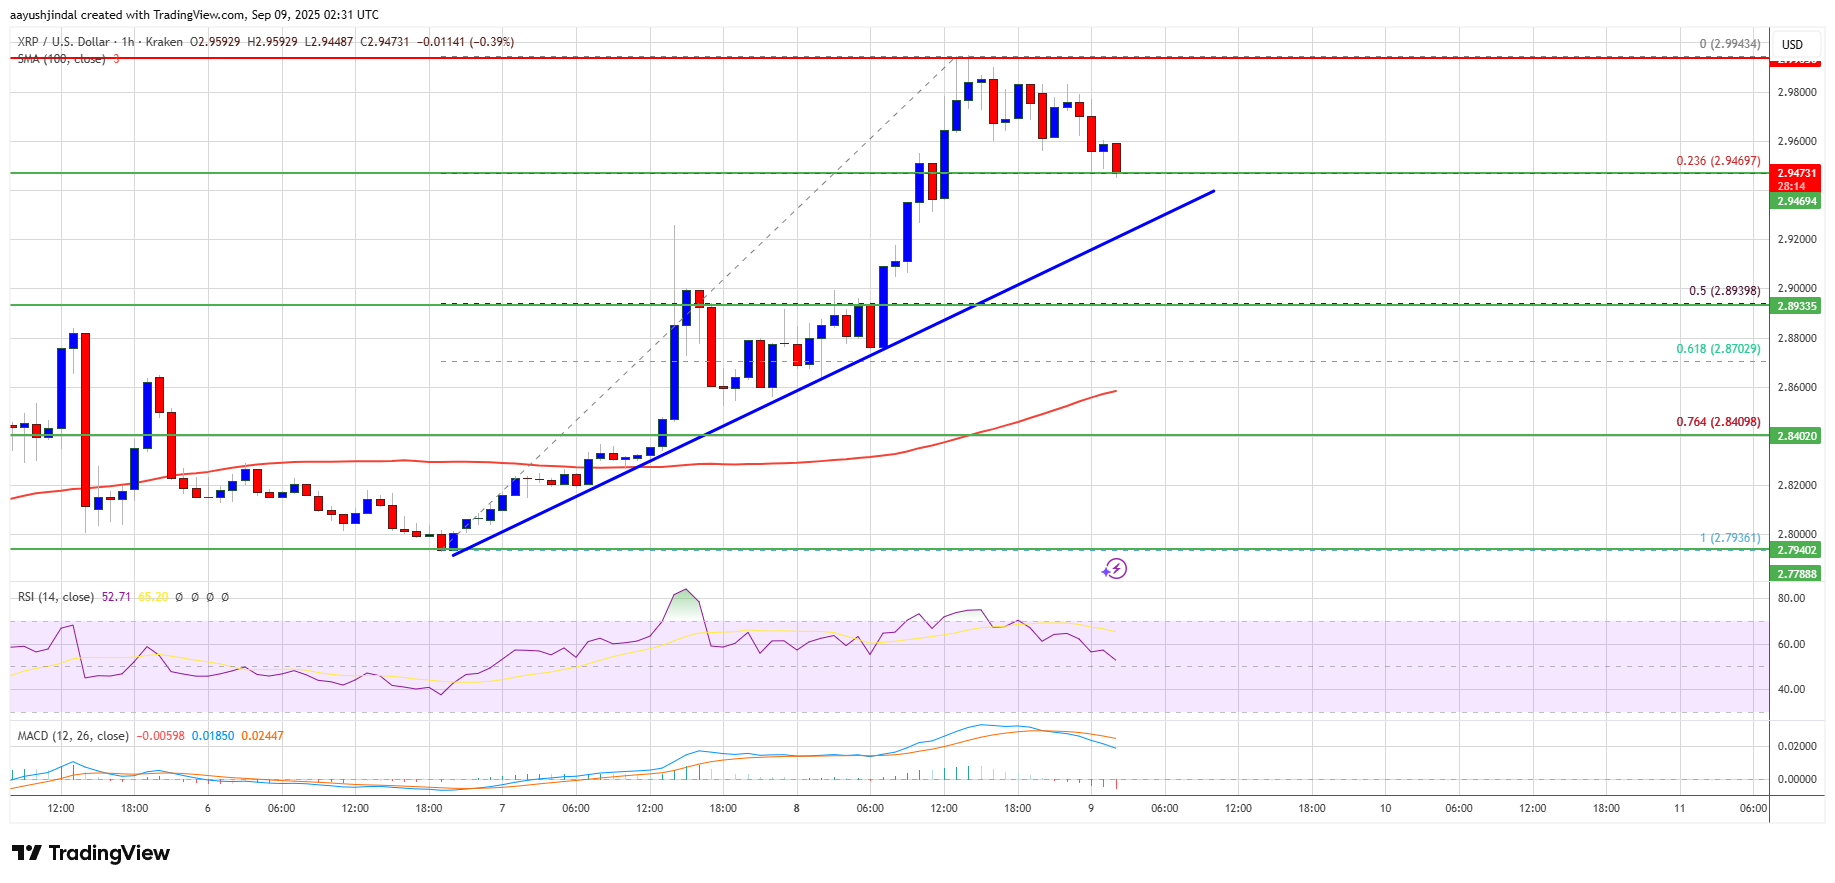
If the bulls protect the $2.930 support, the price could attempt another increase. On the upside, the price might face resistance near the $2.980 level. The first major resistance is near the $3.00 level. A clear move above the $3.00 resistance might send the price toward the $3.050 resistance. Any more gains might send the price toward the $3.120 resistance. The next major hurdle for the bulls might be near $3.150.
Another Decline?
If XRP fails to clear the $2.980 resistance zone, it could continue to move down. Initial support on the downside is near the $2.930 level and trend line. The next major support is near the $2.8920 level or the 50% Fib retracement level of the upward move from the $2.794 swing low to the $2.994 high.
If there is a downside break and a close below the $2.8920 level, the price might continue to decline toward $2.860. The next major support sits near the $2.850 zone, below which the price could gain bearish momentum.
Technical Indicators
Hourly MACD – The MACD for XRP/USD is now losing pace in the bullish zone.
Hourly RSI (Relative Strength Index) – The RSI for XRP/USD is now above the 50 level.
Major Support Levels – $2.930 and $2.860.
Major Resistance Levels – $2.980 and $3.00.
Disclaimer: The content of this article solely reflects the author's opinion and does not represent the platform in any capacity. This article is not intended to serve as a reference for making investment decisions.
You may also like
Don't be fooled by the rebound! Bitcoin could retest the lows at any time | Special Analysis
Analyst Conaldo reviewed bitcoin’s market performance last week using a quantitative trading model, successfully executing two short-term trades with a total return of 6.93%. The forecast for this week is that bitcoin will continue to fluctuate within a range, and corresponding trading strategies have been formulated. Summary generated by Mars AI. The accuracy and completeness of this summary, generated by the Mars AI model, are still being updated and iterated.

Espresso co-founder’s decade in crypto: I wanted to disrupt Wall Street’s flaws, but witnessed a transformation into a casino instead
Everything you've been hoping for may have already arrived; it just looks different from what you expected.

Solana Foundation Steps In as Kamino and Jupiter Lend Dispute Intensifies

Bitcoin Firms Confront the Boomerang Effect of Excessive Leverage