Date: Tue, Sept 09, 2025 | 06:40 AM GMT
The cryptocurrency market is showing strength after Ethereum (ETH) demonstrated resilience around the $4,300 level following a retreat from its recent high of $4,953. Riding on this momentum, several altcoins are flashing bullish potential, and Raydium (RAY) is one of the tokens drawing attention.
Currently, RAY is trading back in the green, and more importantly, its chart structure suggests that further upside may be on the horizon.
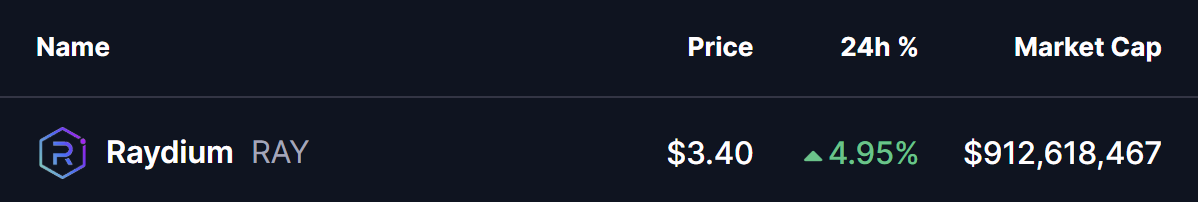 Source: Coinmarketcap
Harmonic Pattern Hints at Potential Upside
On the daily chart, RAY is forming a Bearish Butterfly harmonic pattern. Despite its name, this setup often results in a bullish continuation during the CD leg, particularly as price action heads into the Potential Reversal Zone (PRZ).
The pattern started at point X ($4.11), dipped to A, rallied to B, and then retraced to C near $3.14. From there, RAY has begun recovering, now trading around $3.40.
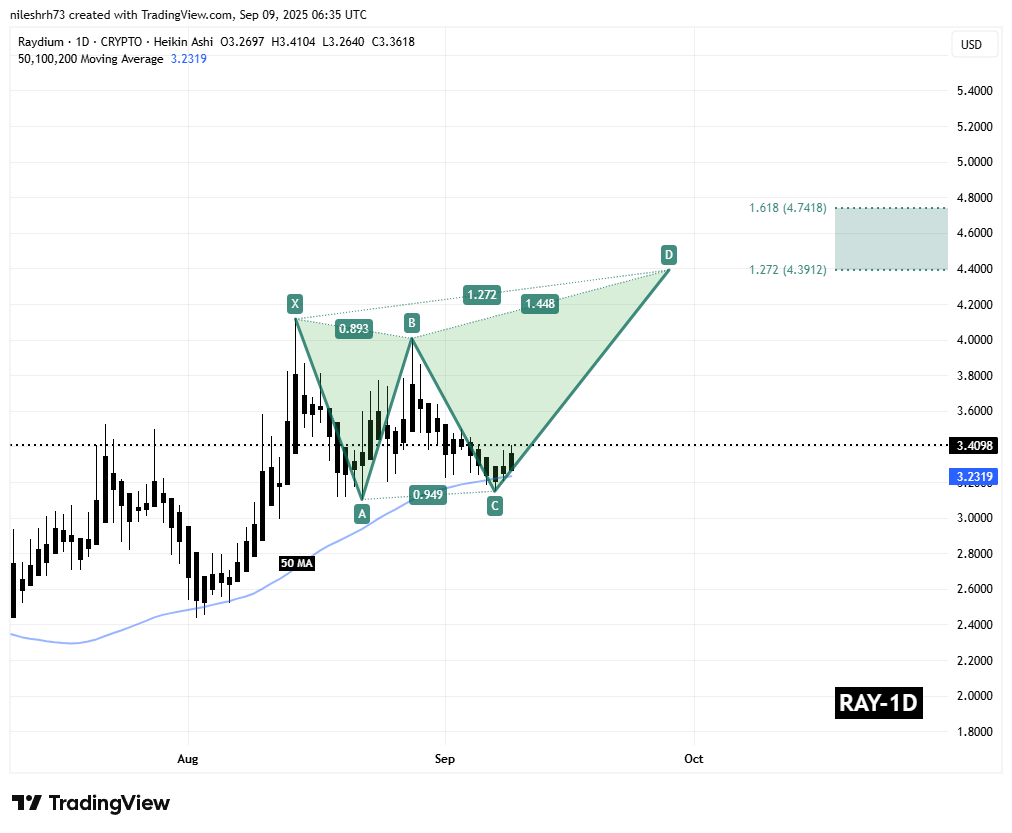 Raydium (RAY) Daily Chart/Coinsprobe (Source: Tradingview)
A key technical development is that RAY has reclaimed its 50-day moving average ($3.23), flipping it into strong support — a signal that strengthens the bullish continuation case.
What’s Next for RAY?
If bulls defend the 50-day MA at $3.23, RAY could extend higher into the PRZ zone between $4.39 (1.272 Fibonacci extension) and $4.74 (1.618 extension). These Fibonacci targets mark the Butterfly completion zone and represent the next potential upside objectives for the token.
However, failure to hold above the 50-day MA could invalidate this bullish setup and bring a retest of the $3.14 support region back into play.