Date: Thu, Sept 11, 2025 | 08:20 AM GMT
The cryptocurrency market is showing strength amid the anticipated potential US Federal Reserve rate cuts, with Ethereum (ETH) holding firm at $4,400. Following this resilience, several memecoins are beginning to flash bullish setups — including Pepe (PEPE).
PEPE has gained an impressive 10% over the past week, and more importantly, its price chart is signaling a harmonic structure that could point to further upside in the near term.
 Source: Coinmarketcap
Harmonic Pattern Hints at Potential Upside
On the daily chart, PEPE is forming a Bearish Cypher harmonic pattern. Despite the bearish name, this setup often delivers a bullish CD leg rally before price action nears its Potential Reversal Zone (PRZ).
The structure began at Point X ($0.00001475), corrected down to Point A, rebounded to Point B, and then dropped sharply to Point C ($0.00000914). Since then, PEPE has bounced strongly, reclaiming its 200-day moving average (MA) and is now trading near $0.00001062, showing notable resilience.
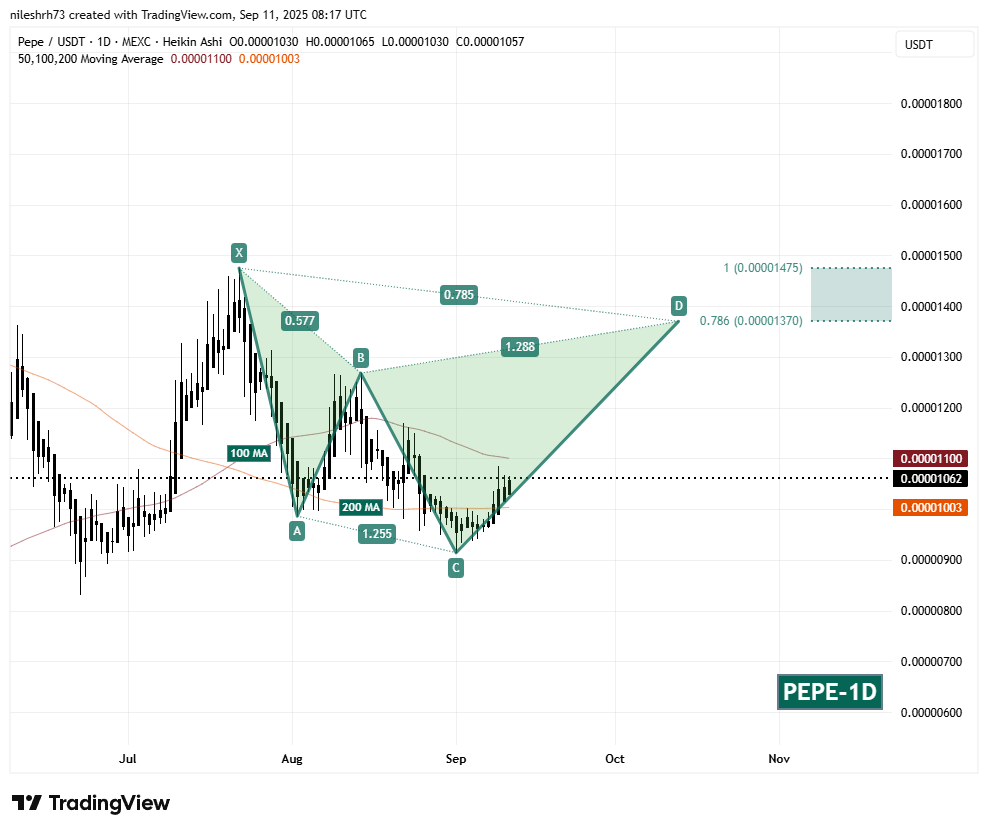 PEPE Daily Chart/Coinsprobe (Source: Tradingview)
The immediate resistance to watch is the 100-day MA at $0.000011. A sustained breakout above this level would confirm bullish momentum and set the stage for higher moves.
What’s Next for PEPE?
If bulls successfully reclaim the 100-day MA, the CD leg could extend toward the PRZ between $0.00001370 (0.786 Fibonacci extension) and $0.00001475 (1.0 extension). These zones historically mark where the cypher pattern completes, making them critical upside targets.
On the downside, it’s equally important for PEPE to hold support around the 200-day MA ($0.00001003). A breakdown below this level could invalidate the structure and weaken the bullish setup.