XRP price outlook: XRP has shifted from neutral to a midterm bearish trend after forming a confirmed lower high. Immediate risk is a drop below the $3.00 psychological support, which could accelerate declines toward $2.90 and the 200 EMA near $2.81 without renewed buying pressure.
-
Lower high confirms bearish reversal
-
Immediate support at $3.00, next targets $2.90 and $2.81 (200 EMA)
-
On-chain liquidations of $6.4M and falling funding rates signal waning bullish bets
XRP price outlook: immediate risk below $3.00; watch $3.10-$3.20 for recovery. Read analyst take and action points.
What is XRP’s current price outlook?
XRP price outlook is bearish in the midterm after the token formed a confirmed lower high and has weakened on declining volume. The market is testing the $3.00 psychological support; a decisive break could push XRP toward $2.90 and $2.81 (200 EMA) in the near term.
How did the market confirm the bearish reversal?
Traders observed a distinct lower high formation on daily and 4-hour charts, signaling sellers regained control. Volume declined during attempts to rally, which weakens bullish conviction. On-chain and derivatives data show $6.4 million in recent liquidations, further supporting a negative bias.
What are the immediate support and resistance levels?
| $3.20 | Short-term resistance to reclaim bullish momentum | Recent consolidation zone |
| $3.00 | Psychological support; immediate invalidation level | Round number support |
| $2.90 | Near-term technical support | Previous swing low |
| $2.81 | 200 EMA — key dynamic support | 200-period EMA on daily chart |
XRP is currently switching from a neutral to bearish trend on the market. The asset has now established a distinct lower high, a classic indication of a bearish reversal after battling for weeks to maintain momentum. This formally marks the return of XRP to a midterm bear market phase. XRP is trading near $3.03 and has lost over 1% in the past 24 hours.
Why are funding rates and liquidations important now?
Funding rates that move against bulls indicate speculative positions are being unwound. Over the last day, $6.4 million in long liquidations occurred, signaling forced selling. Open interest remains elevated on major exchanges, which could amplify moves if sellers continue to dominate.
What does on-chain and derivatives data imply?
On-chain signals point to declining demand; derivatives data show funding rate pressure and concentrated open interest. Together these metrics suggest speculative long positions are vulnerable and increase the likelihood of a sharper correction if $3.00 fails to hold.
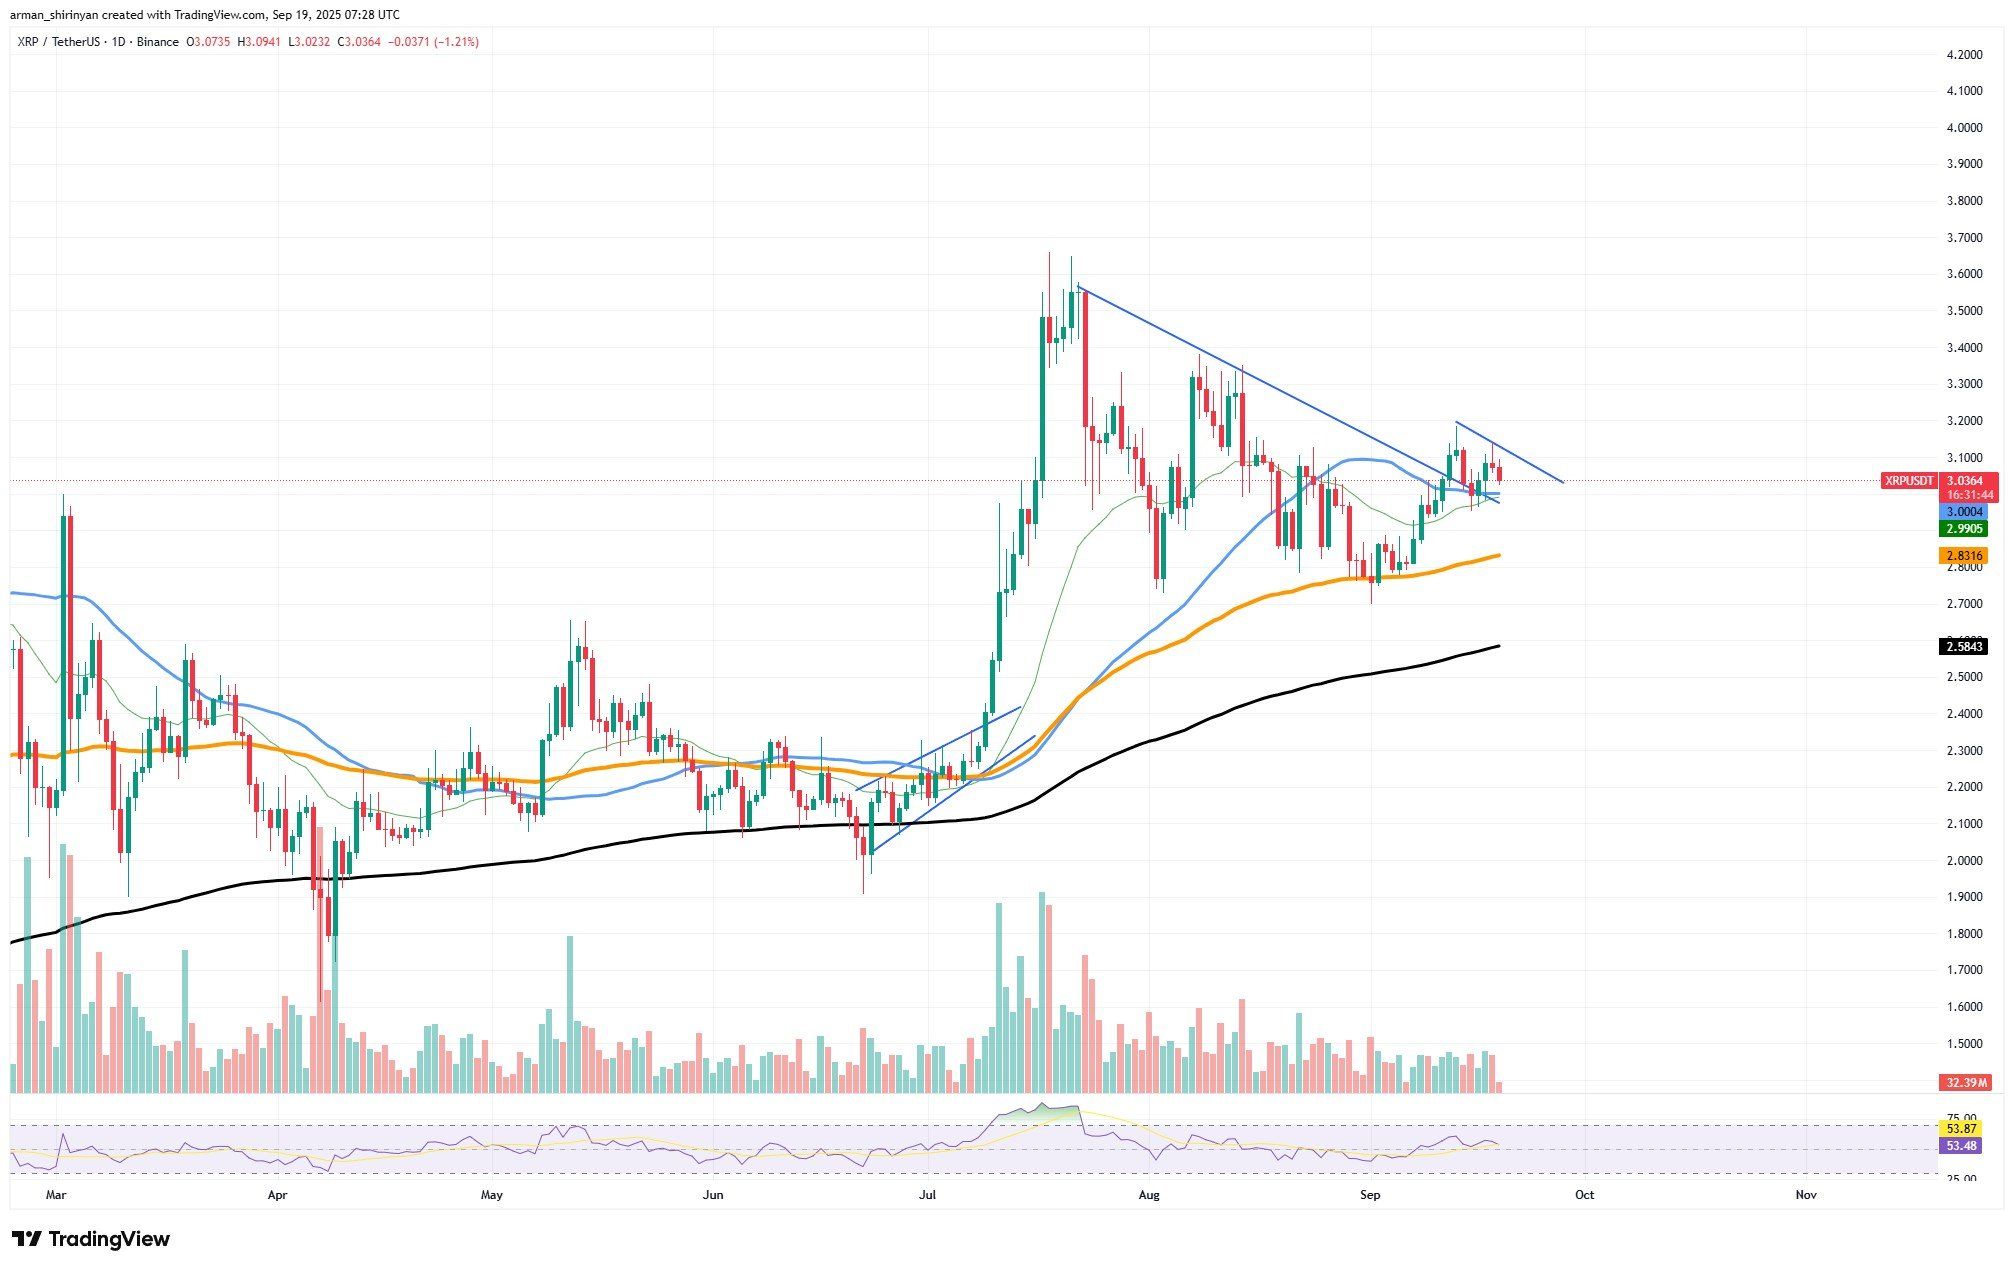
XRP/USDT Chart by TradingView
How can traders and investors react?
- Short-term traders: Consider protective stops below $3.00 and size positions to account for higher volatility.
- Swing traders: Wait for reclaim of $3.10–$3.20 range before increasing long exposure.
- Long-term holders: Monitor whether declines create buying opportunities near the 200 EMA but avoid averaging into accelerating sell-offs.
Frequently Asked Questions
Is XRP likely to drop below $3.00 today?
It is possible. Persistent selling pressure and declining volume make a break below $3.00 likely within the next trading sessions unless bulls reclaim $3.10–$3.20 quickly.
What would invalidate the bearish outlook?
A sustained recovery above $3.20 on rising volume and improving funding rates would invalidate the current bearish structure and suggest renewed bullish momentum.
Key Takeaways
- Confirmed lower high: Signals a midterm bearish reversal for XRP.
- Critical support $3.00: A break likely accelerates declines to $2.90 and $2.81 (200 EMA).
- Derivatives red flags: $6.4M long liquidations and falling funding rates indicate weakening bullish bets.
Conclusion
The XRP price outlook is bearish in the midterm after a confirmed lower high and weakening on-chain signals. Traders should watch the $3.10–$3.20 recovery zone for any momentum shift and manage risk around the $3.00 support. COINOTAG will monitor on-chain and derivatives updates and publish timely guidance.