Date: Wed, Sept 24, 2025 | 03:30 AM GMT
The cryptocurrency market is under notable selling pressure, with Bitcoin (BTC) sliding to below the $112K level after a 4% weekly drop. Monday alone witnessed record liquidations of nearly $1.7 billion, sparking volatility across the entire altcoin market.
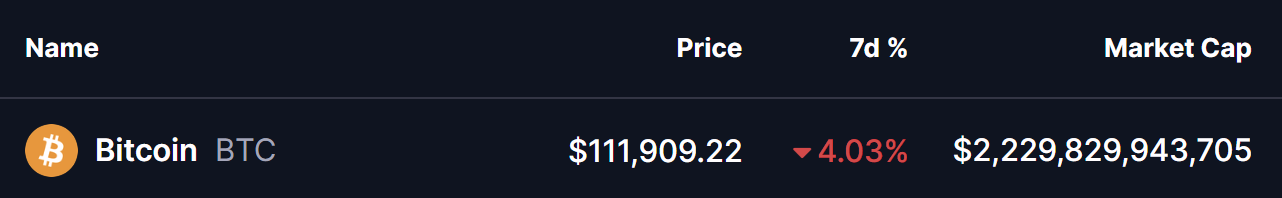 Source: Coinmarketcap
Yet, beyond the short-term pain, the charts are painting a much bigger picture. A familiar fractal pattern—one that echoes Bitcoin’s past cycle behavior—may be signaling that a powerful rebound lies ahead.
September 2017 Fractal Suggests Bullish Continuation
According to insights from crypto analyst @degengambleh , Bitcoin’s recent correction strongly resembles its price behavior during September 2017. Back then, BTC also faced heavy selling pressure after an aggressive rally, printing a sharp pullback that shook out weak hands.
But instead of confirming a bearish reversal, that correction set the stage for an explosive continuation rally—pushing Bitcoin to fresh all-time highs within just a few months.
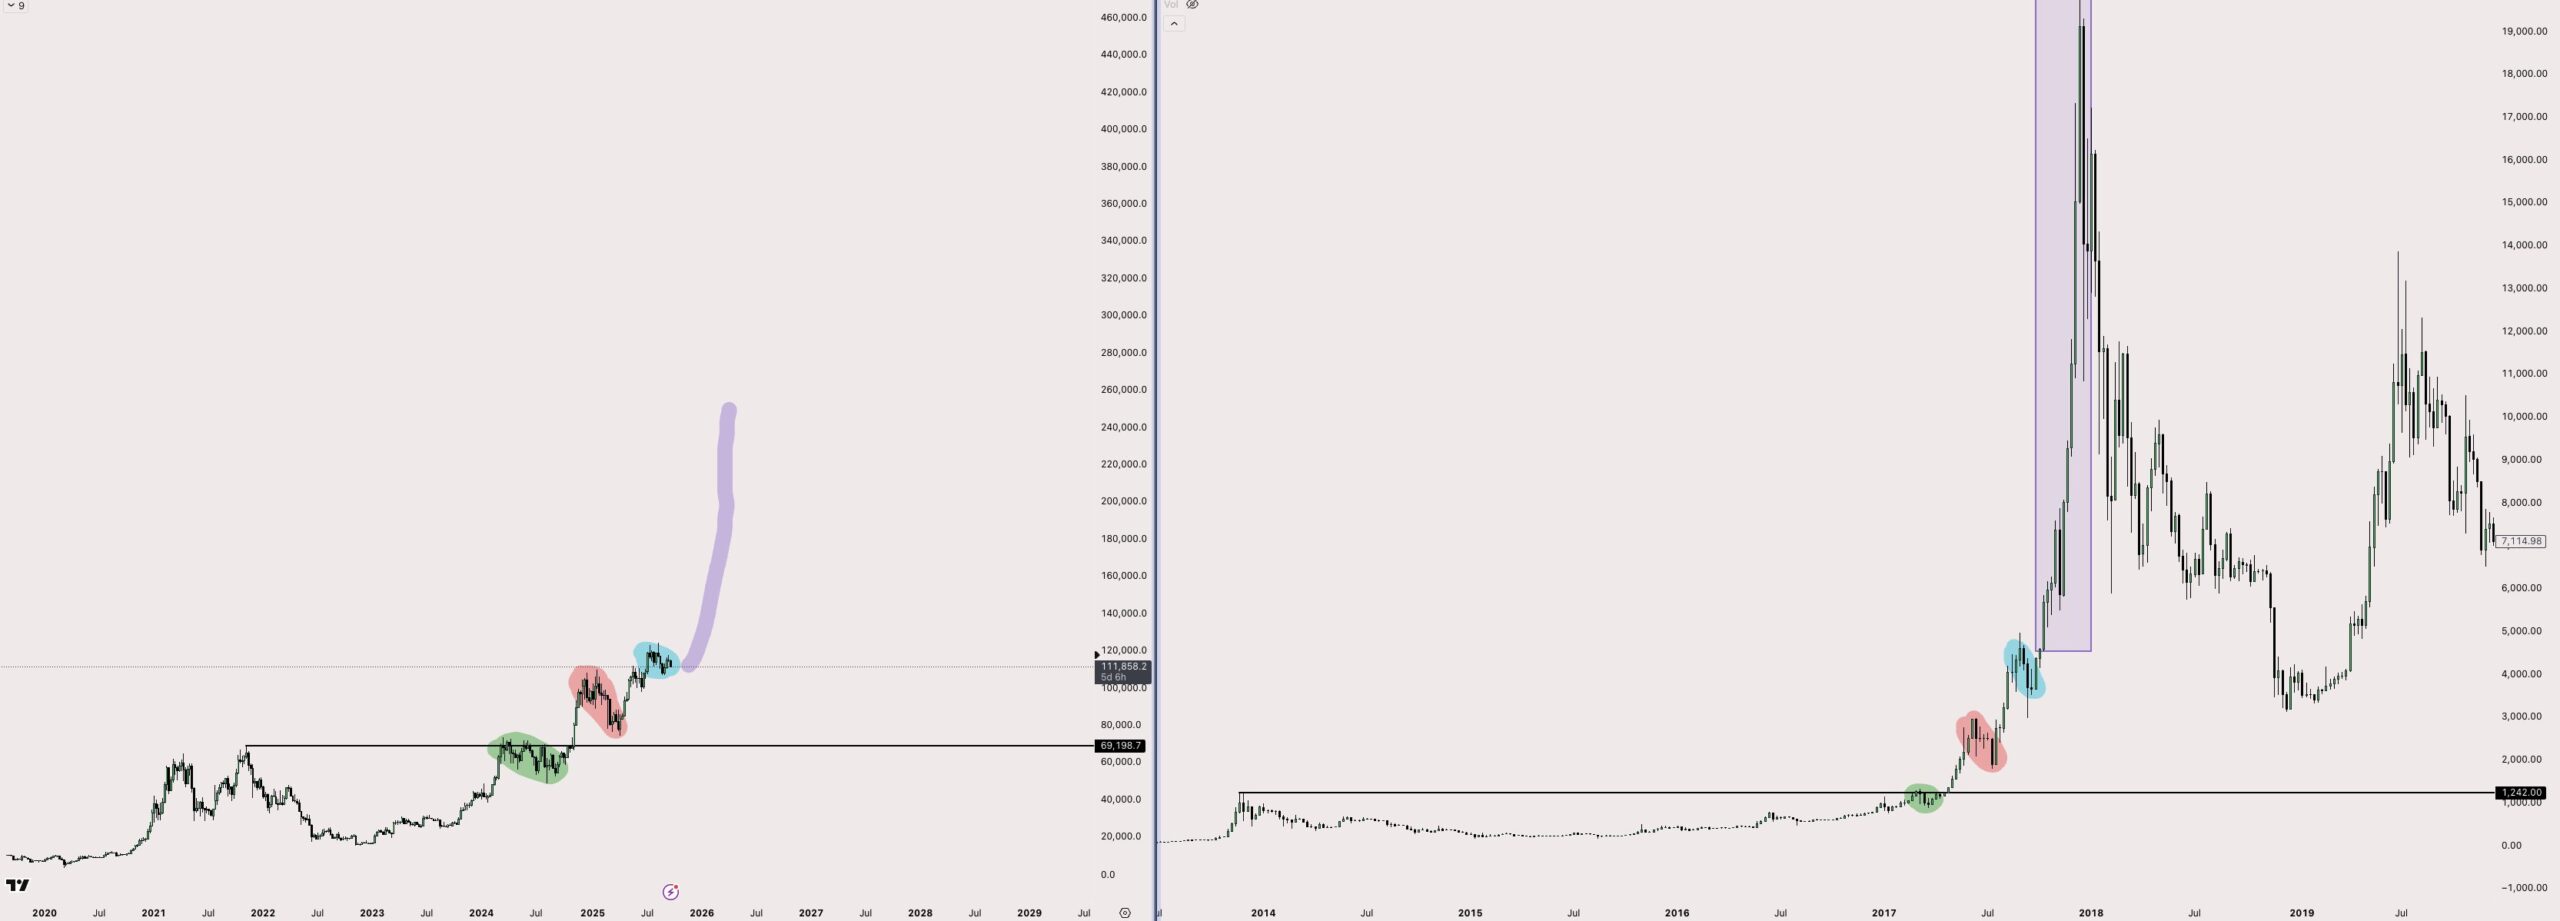 Bitcoin (BTC) Fractal Chart/Credits: @degengambleh (X)
The chart comparison highlights striking similarities:
- A green accumulation phase before the breakout.
- A red correction wave that caused panic.
- A blue rebound zone, where the trend flipped bullish again.
The same sequence appears to be unfolding right now, with BTC bouncing off the $111K region in almost identical fashion to 2017’s fractal setup.
What’s Next for BTC?
If this fractal continues to play out, current price weakness could simply be a healthy correction rather than the start of a deeper downturn. A rebound from this zone may fuel another leg up, with bulls eyeing the next parabolic phase.
Should history repeat itself, Bitcoin could be gearing up for its most explosive quarter yet, potentially carrying prices well beyond current levels as market momentum re-accelerates.
Still, caution is warranted—fractals can rhyme, but they don’t always repeat perfectly. Traders will want to watch for confirmation signals before fully betting on the upside scenario.