

- BNB Faces Bearish Market Conditions: BNB’s price shows a clear downward trend, with negative momentum confirmed by moving averages and MACD.
- MYTH Struggles to Gain Momentum: Despite an initial spike, MYTH’s price continues to decline, with bearish indicators pointing to further challenges.
- IMX Shows Potential for Recovery: IMX, while volatile, hints at a potential bullish reversal, supported by slight bullish crossovers in its moving averages.
The blockchain ecosystem has seen a surge in NFTs , with BNB, IMX, and MYTH leading the charge. Their consistent presence in the NFT market makes them crucial players in the industry. As the NFT space continues to grow, these blockchains provide unique features and benefits for creators and collectors alike. With each blockchain gaining momentum in terms of sales volume, its influence in the market cannot be ignored.
BNB: A Strong Bearish Sentiment in the Market
BNB has recently experienced a downward shift in price, signaling a bearish trend. The price fluctuated from around 969.08 down to 968.82, showing a modest range of just 0.53%. Despite minor fluctuations, the price action suggests continued weakness.
The moving averages (MA5, MA10, MA60) indicate a bearish setup. The short-term moving average (MA5) lies below the longer-term ones, a classic sign of downward momentum. This bearish alignment is further confirmed as the price remains below the MA5, signaling further potential declines.
The MACD histogram reveals negative momentum, with the MACD line dipping into the red zone. The red histogram bars further reinforce the bearish trend, indicating ongoing selling pressure in the market. As the price continues to stay below key moving averages, BNB’s outlook remains bearish in the short term.
MYTH: Persistent Bearish Trend Continues
The MYTH blockchain has also seen a decline in its market activity. The price began at 0.0528 before experiencing a gradual fall, which has largely been a steady downward trend. Despite the early spike, the price struggles to make significant gains, currently holding steady at 0.0528.
All three moving averages (MA5, MA10, MA20) follow a bearish trend, indicating a continued downward movement. The short-term moving averages are above the longer-term ones, reflecting an overall negative bias. This alignment suggests that the price may continue to struggle, unable to break above any significant resistance levels.
The MACD analysis shows that the blockchain remains firmly in a bearish state. The MACD line stays well below the zero line, and the gap between the MACD and the signal line widens. The increased negative momentum is visible through the histogram, which displays mostly red bars, signaling further downside pressure in the market.
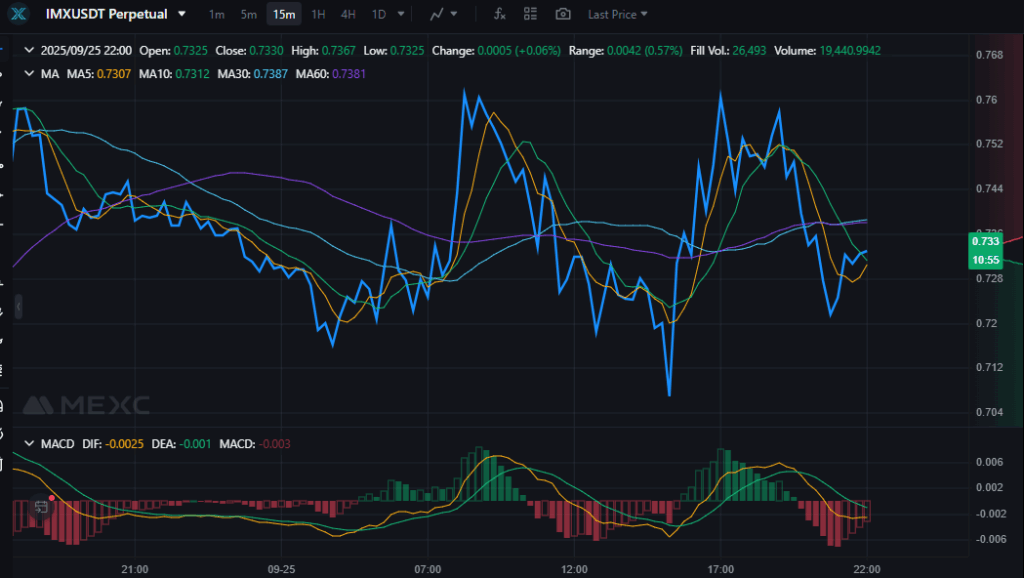
IMX: A Slight Recovery in a Volatile Market
Unlike BNB and MYTH, IMX has shown more volatility in its price movements. The price fluctuated between 0.7325 and 0.7367, with some recovery seen toward the latter part of the day. The blockchain shows an overall mixed performance, balancing between bullish and bearish indicators.
The moving averages for IMX suggest the market is stabilizing. The short-term moving averages (MA5 and MA10) show slight bullish crossovers, indicating potential upside. As the price hovers around these levels, the trend shows some signs of recovery, though not yet enough to establish a solid bullish trend.
The MACD histogram is relatively neutral, with small fluctuations around zero. The MACD line and the signal line are close to each other, suggesting indecision in the market. However, small green bars in the histogram could indicate that the bullish momentum is building, albeit at a slow pace.
Conclusion
BNB, MYTH, and IMX continue to play significant roles in the growing NFT market. While BNB and MYTH remain in bearish territory, IMX shows signs of potential recovery. Their movements are closely tied to market conditions, and further changes in price action could dictate future trends. These blockchains are integral to the NFT ecosystem, and their sales volume is a testament to their growing presence in the market.


![[Bitpush Daily News Selection] Canary spot XRP ETF records $580 million in trading volume on its first day, setting this year's ETF launch record; Strategy shares fall to a 13-month low, still trading at nearly a 20% premium to its bitcoin holdings; Chicago Board Options Exchange to launch prediction markets within months, but will avoid sports events](https://img.bgstatic.com/multiLang/image/social/3ee473643d7ef9db56ddfe60a7ebbe8b1763027641206.png)