Chainlink price analysis: LINK is consolidating near $21.89 inside a multi‑year symmetrical triangle, with $16 identified as critical support and potential entry. A sustained rebound above $22 could resume an upside path toward longer‑term Fibonacci targets near $100 if triangle structure holds into 2026.
-
Chainlink consolidates at $21.89 with $16 as decisive support.
-
Fibonacci support levels: $16.65 (0.5) and $12.65 (0.382); resistance near $22 and projected extensions to $35–$100.
-
Market metrics: ~$13.84B market cap, >$1B daily volume, repeated resistance retests around $22.
Chainlink price analysis: LINK near $21.89, $16 support critical — monitor for a breakout toward $100 if consolidation holds. Read latest technical levels and targets.
What is Chainlink’s immediate price outlook?
Chainlink price analysis shows LINK trading near $21.89 inside a multi‑year symmetrical triangle, with $16 identified as a key support zone. Short‑term momentum favors consolidation; a rebound above $22 would increase odds of higher Fibonacci extension targets over the next 12–18 months.
How likely is a dip to $16 and what are the technical targets?
Price action and Fibonacci retracements point to $16.65 (0.5) and $12.65 (0.382) as immediate supports. Analysts including Ali Martinez and Michael van de Poppe highlight $16 as a high‑probability support area. If LINK tests $16 and holds, common technical projections place extensions at $35, $51, $73, $93 and a longer‑term target near $100 via the 1.272 extension.
Key Technical Levels and Triangle Setup
Chainlink has traded between roughly $5 and $35 over the past three years, forming a large symmetrical triangle defined by higher lows and converging resistance. Price currently sits near the middle of that range at $21.89 after a recent 4.55% intraday decline.
Fibonacci retracement levels provide clear references for traders: the 0.5 retracement sits at $16.65 and the 0.382 retracement at $12.65. Analysts cite $16 as a meaningful support zone inside the triangle, with the structure projecting higher targets if consolidation holds.
A dip to $16 on Chainlink $LINK would be a gift. This triangle breakout setup targets $100! pic.twitter.com/s69oqbMniB
— Ali (@ali_charts) September 25, 2025Resistance sits near $22.24 (0.786 retracement). Above that, technical targets include $35, $51, $73 and $93; the triangle projection and a 1.272 Fibonacci extension suggest a longer‑term objective near $100 if price sustains above the lower boundary.
Market Data and Analyst Perspectives
Chainlink’s market capitalization is roughly $13.84 billion with daily trading volume above $1 billion, according to Coingecko data referenced by market observers. Circulating supply is near 678 million LINK, against a 1 billion maximum supply, indicating liquidity and participation consistent with large‑cap altcoin behavior.
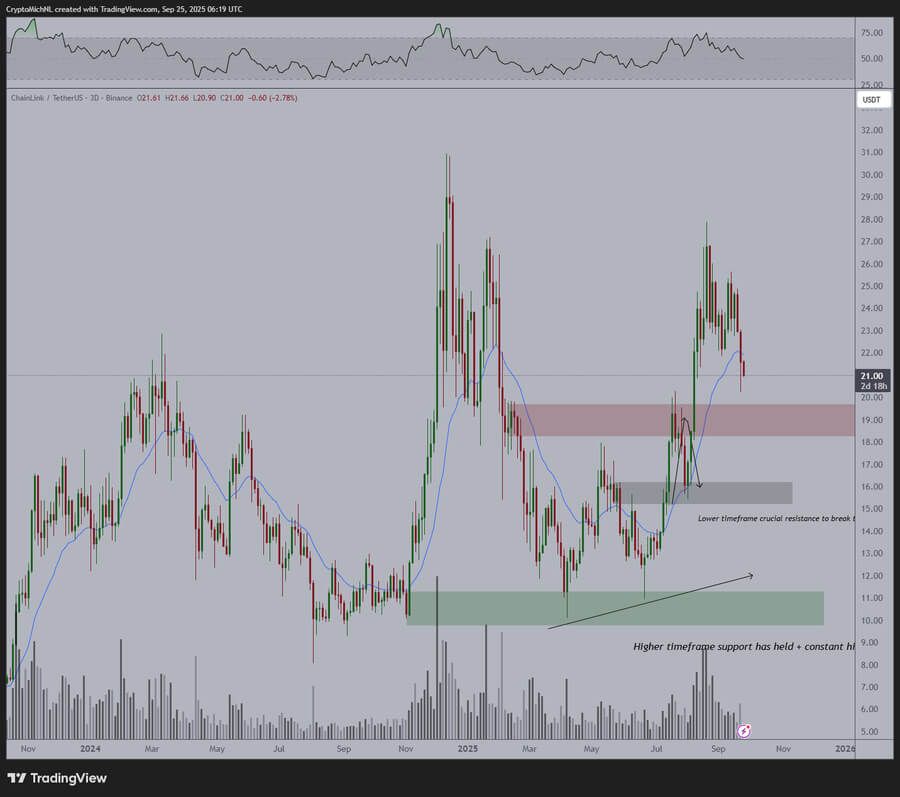 Source: MichaelvandePoppe(X)
Charts show repeated retests of resistance around $22 while maintaining support closer to $20. Analyst commentary notes that a rebound from $16 could set up a multi‑leg advance toward the aforementioned Fibonacci targets. Quotes include Ali Martinez: “A dip to $16 on Chainlink $LINK would be a gift,” and commentary from Michael van de Poppe describing the zone as higher‑timeframe support.
Frequently Asked Questions
Is $16 confirmed as Chainlink’s major support?
$16 is identified as a critical support zone based on triangle geometry and a 0.5 Fibonacci retracement at $16.65. Confirmation requires price reaction and volume support at or above that level; a clean rejection would strengthen bullish breakout odds.
What targets should traders watch after a rebound?
Watch immediate resistance at $22.24, then extension targets at $35, $51, $73 and $93. A sustained breakout and volume expansion could push the technical extension near $100 over a longer timeframe.
How should risk be managed around the triangle?
Use clear stop levels below the triangle’s lower boundary, scale entries near confirmed support (e.g., $16–$16.65), and size positions to account for volatility. Monitor liquidity metrics and daily volume for confirmation.
Key Takeaways
- Triangle consolidation: Chainlink trades inside a multi‑year symmetrical triangle centered near $21.89.
- Critical support: $16 (0.5 Fibonacci area) is the decisive support to watch; a hold increases breakout odds.
- Actionable plan: Monitor volume and $22 resistance for breakout confirmation; manage risk with stops below the triangle boundary.
Conclusion
Chainlink price analysis shows LINK in a prolonged consolidation at $21.89, with $16 as a key technical support and a structured path to higher Fibonacci targets if the triangle resolves to the upside. Market participants should prioritize confirmation via volume and retests; COINOTAG will continue to monitor price action and publish updates as conditions evolve.