
Key takeaways
- SOL has dropped below $210 after starting the week bullish.
- The coin could drop below $200 if the bullish trend fails to gain momentum.
SOL fails to surpass the $220 resistance level
SOL, the native coin of the Solana blockchain, has lost less than 1% of its value in the last 24 hours. At press time, it is trading at $208 per coin.
The negative performance comes after SOL and the broader crypto market had a positive start to the week. SOL rallied to the $215 level on Monday, recovering from the $190 support level it touched on Friday.
However, SOL failed to build on this momentum, with the $220 resistance level knocking down the price below $210. Its performance aligned with Bitcoin and Ether, with BTC encountering key resistance above $114k. Ether also failed to top the $4,232 resistance level after surging past $4,100 on Monday.
SOL could drop below $200
The SOL/USD 4-hour chart remains bearish and efficient as SOL failed to hit $220. The technical indicators on the 4-hour timeframe remain bullish despite the strong resistance.
The RSI of 52 is above the neutral 50, indicating that SOL is still building a bullish momentum despite the choppy market conditions. The MACD lines are also above the neutral zone, suggesting a bullish bias.
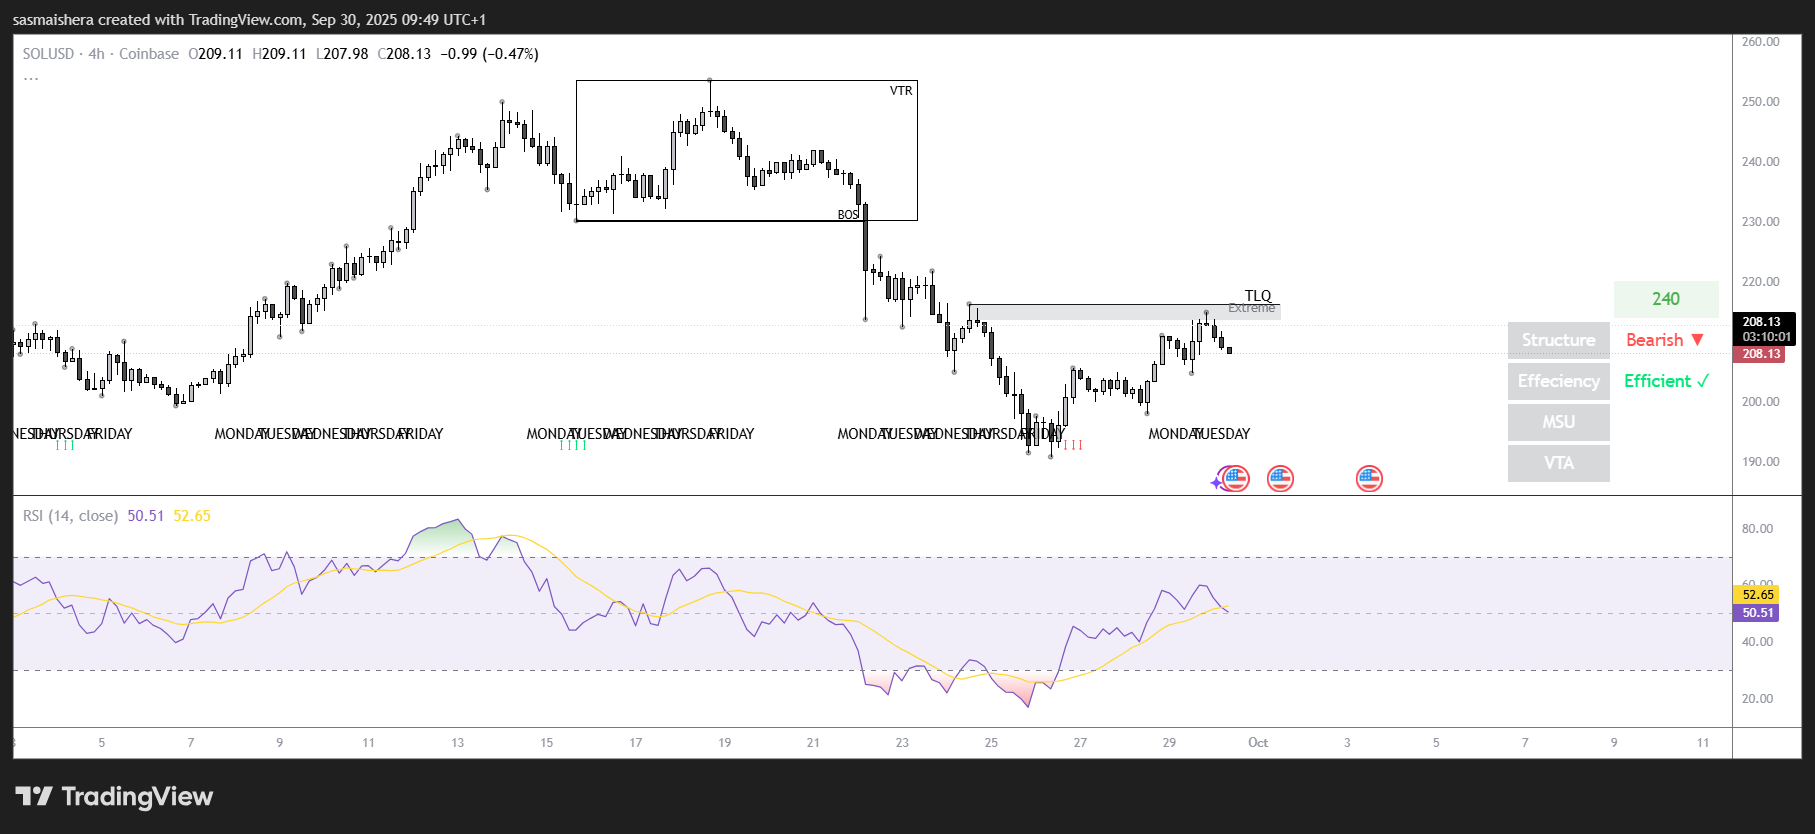
If the market recovery continues, SOL could look to surge past the $220 resistance level once again. Surpassing this key resistance level would allow SOL to rally towards the $240 zone in the near term.
On the flipside, if the $220 resistance level holds strong, SOL could drop below the $200 mark for the first time since Sunday. The $190 support level could probably provide a bounce back for SOL. Failure to hold this support level could see SOL drop lower towards the $175 support region.