- XRP is currently trading at $2.93 showing a 24h gain of 3.1%, with a support at $2.82 and a resistance of $2.95.
- RSI values around 62 indicate stable demand whereas the MACD line is slightly positive indicating controlled momentum.
- 7-day and 30-day moving averages, at $1.86 and $0.95, respectively, are lower than the current price, which indicates a powerful recent performance of XRP.
XRP maintained steady price action with the token trading at $2.93 after posting a 3.1% gain in 24 hours . The latest trend was triggered by the fact that short-term technical indicators neared an important resistance line. The XRP was also trading at 0.00002520 BTC as reflected in market data; this is a minor 0.1% increase.
The past day’s trading has remained within the range of $2.82 to $2.95 indicating that both support and resistance levels have been pressurized. It is worth noting that the recent chart readings indicated a tightening of the market elements that may dictate the future of the token.
Support and Resistance Levels
XRP was supported at $2.82, which has already become the cornerstone of the stable price in the latest sessions. An upwards movement was still limited by a ceiling at $2.95, thus supporting a short-term period of consolidation. Both levels carried added weight due to repeated testing in recent hours. The narrow range underlines a market in waiting, with limited space before a breakout or retracement.
Transitioning to moving averages, the short-term seven-day moving average registered at $1.86, showing clear distance from current levels. The 30-day moving average printed at $0.95, also trailing far below market value. These gaps highlighted XRP’s sharp upward surge over recent sessions.
Momentum Indicators Show Steady Demand With Limited Volatility
The Relative Strength Index stood at 62.20, while shorter-frame readings placed the value at 67.60. Both figures suggested the asset stayed below overbought levels, although trending higher. This indicated consistent demand but not extreme buying conditions.
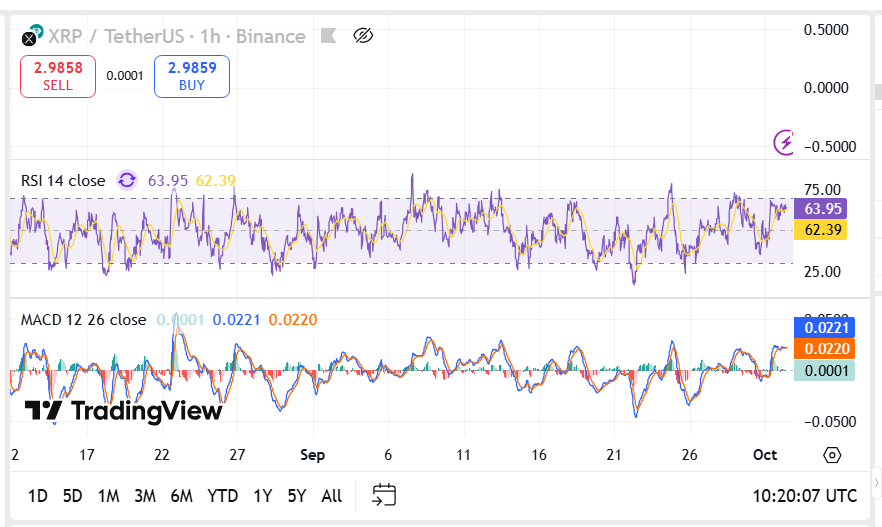 Source: TradingView
The Moving Average Convergence Divergence (MACD) line posted at 0.0220, maintaining a slim positive difference against the signal line. The data implied momentum remained slightly tilted upward, yet without major divergence. These indicators combined illustrated steady activity, though with restrained volatility compared to the prior spike.
XRP Trades Within a Narrow Range as Key Levels Shape Market Outlook
Market positioning showed XRP holding above key moving averages while hovering just under a capped resistance zone. The present structure suggested that market participants were closely watching the $2.95 resistance. At the same time, the defense of $2.82 provided a near-term anchor.
The volumes and liquidity concentrations at such levels have strengthened their significance. The price may be kept in the range of $2.82 and $2.95 in case the resistance zone is maintained. However, support levels of the holding firm underscored that buyers continued to defend lower territory, keeping conditions steady.
As the charts indicated, XRP traded in a narrow corridor with measured momentum . With short-term signals aligned, the market awaited clearer direction beyond the established price levels.