SOL Now on Fidelity’s Retail Platform as Price Tests $195 While $188 Support Draws Focus

Solana SOL$193.20 traded around $191.95 at 15:45 UTC on Oct. 25, after a push toward $195 faded, with traders watching whether the market can hold the high-$180s and convert $192–$195 into a base.
Highlights of the week's Solana news
Earlier today, crypto nalyst Ali Martinez called $188 Solana’s most critical support and shared a Glassnode “realized price distribution” chart — a histogram of where large amounts of SOL last changed hands.
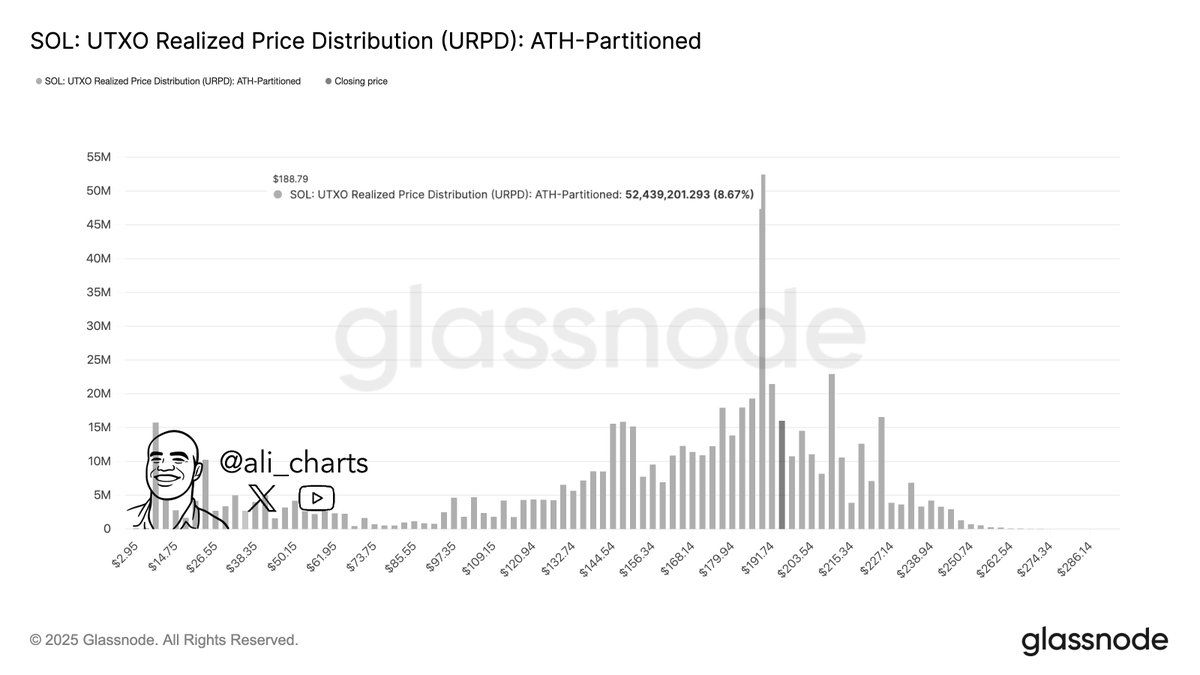
Because a big supply cluster sits near $188, many holders are close to break-even there; such zones often act like floors (holding above them tends to reduce selling, while breaks can invite more supply).
On Oct. 23, Fidelity has added SOL for U.S. brokerage customers, broadening access alongside bitcoin BTC$111,485.51, ether ETH$3,942.96, and LTC$96.42. Access changes don’t decide the day’s tape, but they expand the potential buyer funnel.
On Oct. 20, Gemini announced a Solana edition of the Gemini Credit Card, which was launched in 2023.
The Solana-branded design provides up to 4% back in SOL on gas, EV charging, and rideshare up to a monthly cap, 3% on dining, 2% on groceries and 1% on other purchases, with select merchant offers that can reach 10 percent.
The Gemini Credit Card has no annual fee, no fee to receive crypto rewards and no foreign transaction fees. Gemini is also introducing an option to auto-stake Solana rewards directly; staking APRs can change and are not guaranteed.
Session overview
CoinDesk Research’s technical analysis data model shows SOL edged higher over the prior 24-hour session, traveling about $5.24 ( around 2.7%), with buyers defending $189.25 and sellers showing up near $195. The model’s map: primary support $189.25, secondary $186, and resistance clustered around $195.49, with a nearer intraday shelf near $192.50.
Volume and intraday context
The largest burst hit 09:00 UTC, when volume rose to 786,000 — about 47% above the 24-hour average (534,000) — as price rejected the $195.16 area and slipped into the $192s.
On the 60-minute view, SOL fell from $193.73 to $192.53, with spikes at 14:10 UTC (around 39.9K) and 14:14 UTC (around 41.1K) helping push through $192.50 and set fresh hourly lows. In plain English: $195 behaved like a cap; $192.50 briefly gave way before stabilizing.
What to watch next
- Upside: If SOL closes above $195 (UTC) and holds it, the next area to target is $200–$208.
- Downside: If SOL falls below $192.50 and stays there, a retest of $189.25 is likely, with $186 next; losing the $189–$188 zone would put $183 in view.
CoinDesk 5 Index snapshot (UTC)
Over the same window, the CoinDesk 5 Index rose from 1,929.11 to 1,958.10 (about +1.5%), holding above 1,950 after a morning push.
Latest 24-hour and one-month chart read
As of 15:45–15:46 on Oct. 25, SOL was $191.95 (+0.53% over the period). On the 24-hour chart, $191–$192 acted as an intraday buy zone while $195 capped rebounds.
On the one-month chart, SOL has rebounded from mid-October’s low near $175 but remains below early-October highs around $236, keeping focus on reclaiming $200–$208 and then retesting the early-month peak.
Disclaimer: The content of this article solely reflects the author's opinion and does not represent the platform in any capacity. This article is not intended to serve as a reference for making investment decisions.
You may also like
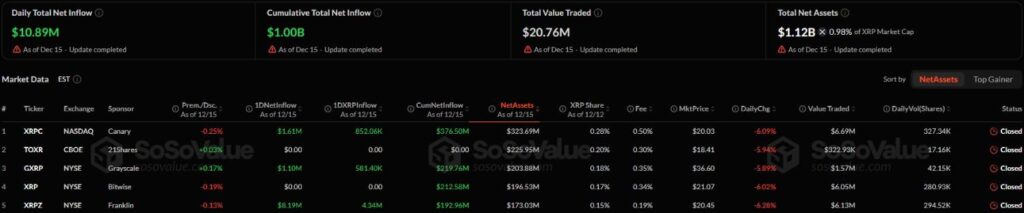
XRP ETF records $1 billion in inflows
AXL Price Crashes 18% as Circle Abandons Token after Acquiring Axelar Network Developer
Nexo Lands Multi-Year Australian Open Sponsorship Deal
Gold Is Overvalued, Rotation into Bitcoin Is Due: Will 80% BTC Crash Theory Hold?