Bitcoin Accelerates Higher As Bulls Target Break Above $115,500 Resistance

Bitcoin price is attempting to recover above $113,500. BTC could rise further if there is a clear move above the $115,500 resistance.
- Bitcoin started a fresh recovery wave above the $113,500 resistance level.
- The price is trading above $114,000 and the 100 hourly Simple moving average.
- There is a bullish trend line forming with support at $113,350 on the hourly chart of the BTC/USD pair (data feed from Kraken).
- The pair might continue to move up if it trades above the $115,500 zone.
Bitcoin Price Starts Fresh Increase
Bitcoin price declined again below the $108,000 level. BTC tested the $106,720 zone and recently started a fresh increase. There was a move above the $112,000 resistance level.
The bulls were able to pump the price above $113,500 and the 100 hourly Simple moving average. Finally, the price spiked above $115,000 and is currently consolidating gains above the 23.6% Fib retracement level of the recent wave from the $106,718 swing low to the $115,400 high.
Besides, there is a bullish trend line forming with support at $113,350 on the hourly chart of the BTC/USD pair. Bitcoin is now trading above $114,000 and the 100 hourly Simple moving average.
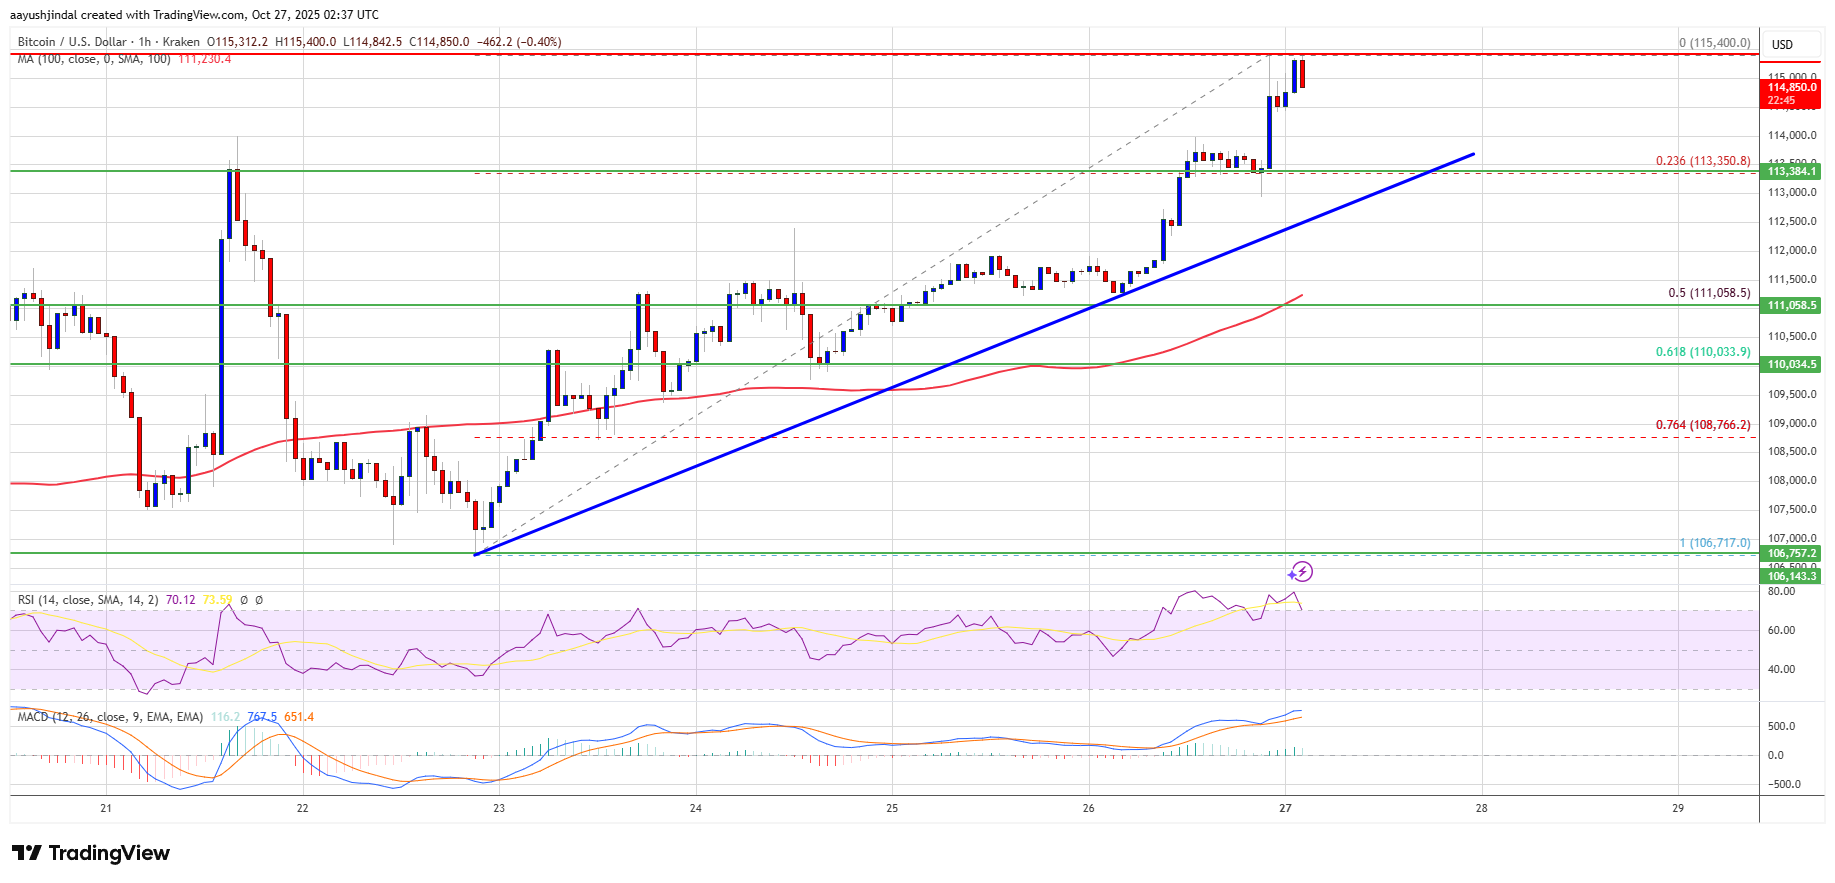
Immediate resistance on the upside is near the $115,250 level. The first key resistance is near the $115,500 level. The next resistance could be $116,200. A close above the $116,200 resistance might send the price further higher. In the stated case, the price could rise and test the $117,000 resistance. Any more gains might send the price toward the $118,000 level. The next barrier for the bulls could be $118,800.
Another Pullback In BTC?
If Bitcoin fails to rise above the $115,500 resistance zone, it could start a fresh decline. Immediate support is near the $114,000 level. The first major support is near the $113,500 level or the trend line.
The next support is now near the $111,000 zone. Any more losses might send the price toward the $110,500 support in the near term. The main support sits at $108,500, below which BTC might struggle to recover in the short term.
Technical indicators:
Hourly MACD – The MACD is now gaining pace in the bullish zone.
Hourly RSI (Relative Strength Index) – The RSI for BTC/USD is now above the 50 level.
Major Support Levels – $114,000, followed by $113,500.
Major Resistance Levels – $115,500 and $116,500.
Disclaimer: The content of this article solely reflects the author's opinion and does not represent the platform in any capacity. This article is not intended to serve as a reference for making investment decisions.
You may also like
Top Trader Expands $360M Long as Profits Hit $16.9M
Quick Take Summary is AI generated, newsroom reviewed. A top trader with a 100% win rate expanded his $360M crypto leveraged long. His holdings include 1,683 BTC and 40,305 ETH, showing bullish conviction. Unrealized profit currently stands at $16.9 million and rising. The move reflects renewed market optimism and potential for near-term rallies.References 💰TRADER WITH 100% WIN RATE ADDS MORE LONGS! He's now playing a $360M leveraged LONG with 1,683 $BTC ($194M) at 13x and 40,305 $ETH ($168M) at 5x. His u
BTC price eyes record monthly close: 5 things to know in Bitcoin this week
ZEC surges 6 times in a month, what is driving this frenzy?
The halving event, privacy narrative, and endorsements from well-known institutions and investors have jointly driven ZEC to surpass its 2021 peak.
Can x402 break the crypto concept of "hype equals peak"?
Unlike typical crypto concepts, x402 has attracted the attention of many Web2 tech giants, and these companies have already begun to adopt the protocol in practice.