
Ethereum Sellers Halt Breakout — But One Group Is Still Hopeful Of A Price Bounce

Ethereum price has struggled to hold momentum after its latest breakout attempt failed on October 27. Cooling accumulation and shrinking exchange outflows explain the pause, yet some signs suggest the rally might not be over. Smart money wallets are quietly adding again, hinting that a rebound could follow if Ethereum clears key resistance soon.
Ethereum (ETH) price has gained about 3.5% in the past week, hinting at a small rebound. But the token is still down more than 2% on the daily chart, showing that selling pressure hasn’t fully eased.
This mix of short-term recovery and daily weakness explains why Ethereum’s breakout attempt failed on October 27 — though one group of investors is still quietly preparing for another bounce.
Cooling Demand Explains The Breakout Failure
Ethereum’s latest rejection has roots in slowing accumulation among active holders.
The holder accumulation ratio, which measures how many wallets are increasing versus cutting their ETH holdings, dropped from 31.278 to 30.964, a 1% decline from its recent 3-month peak.
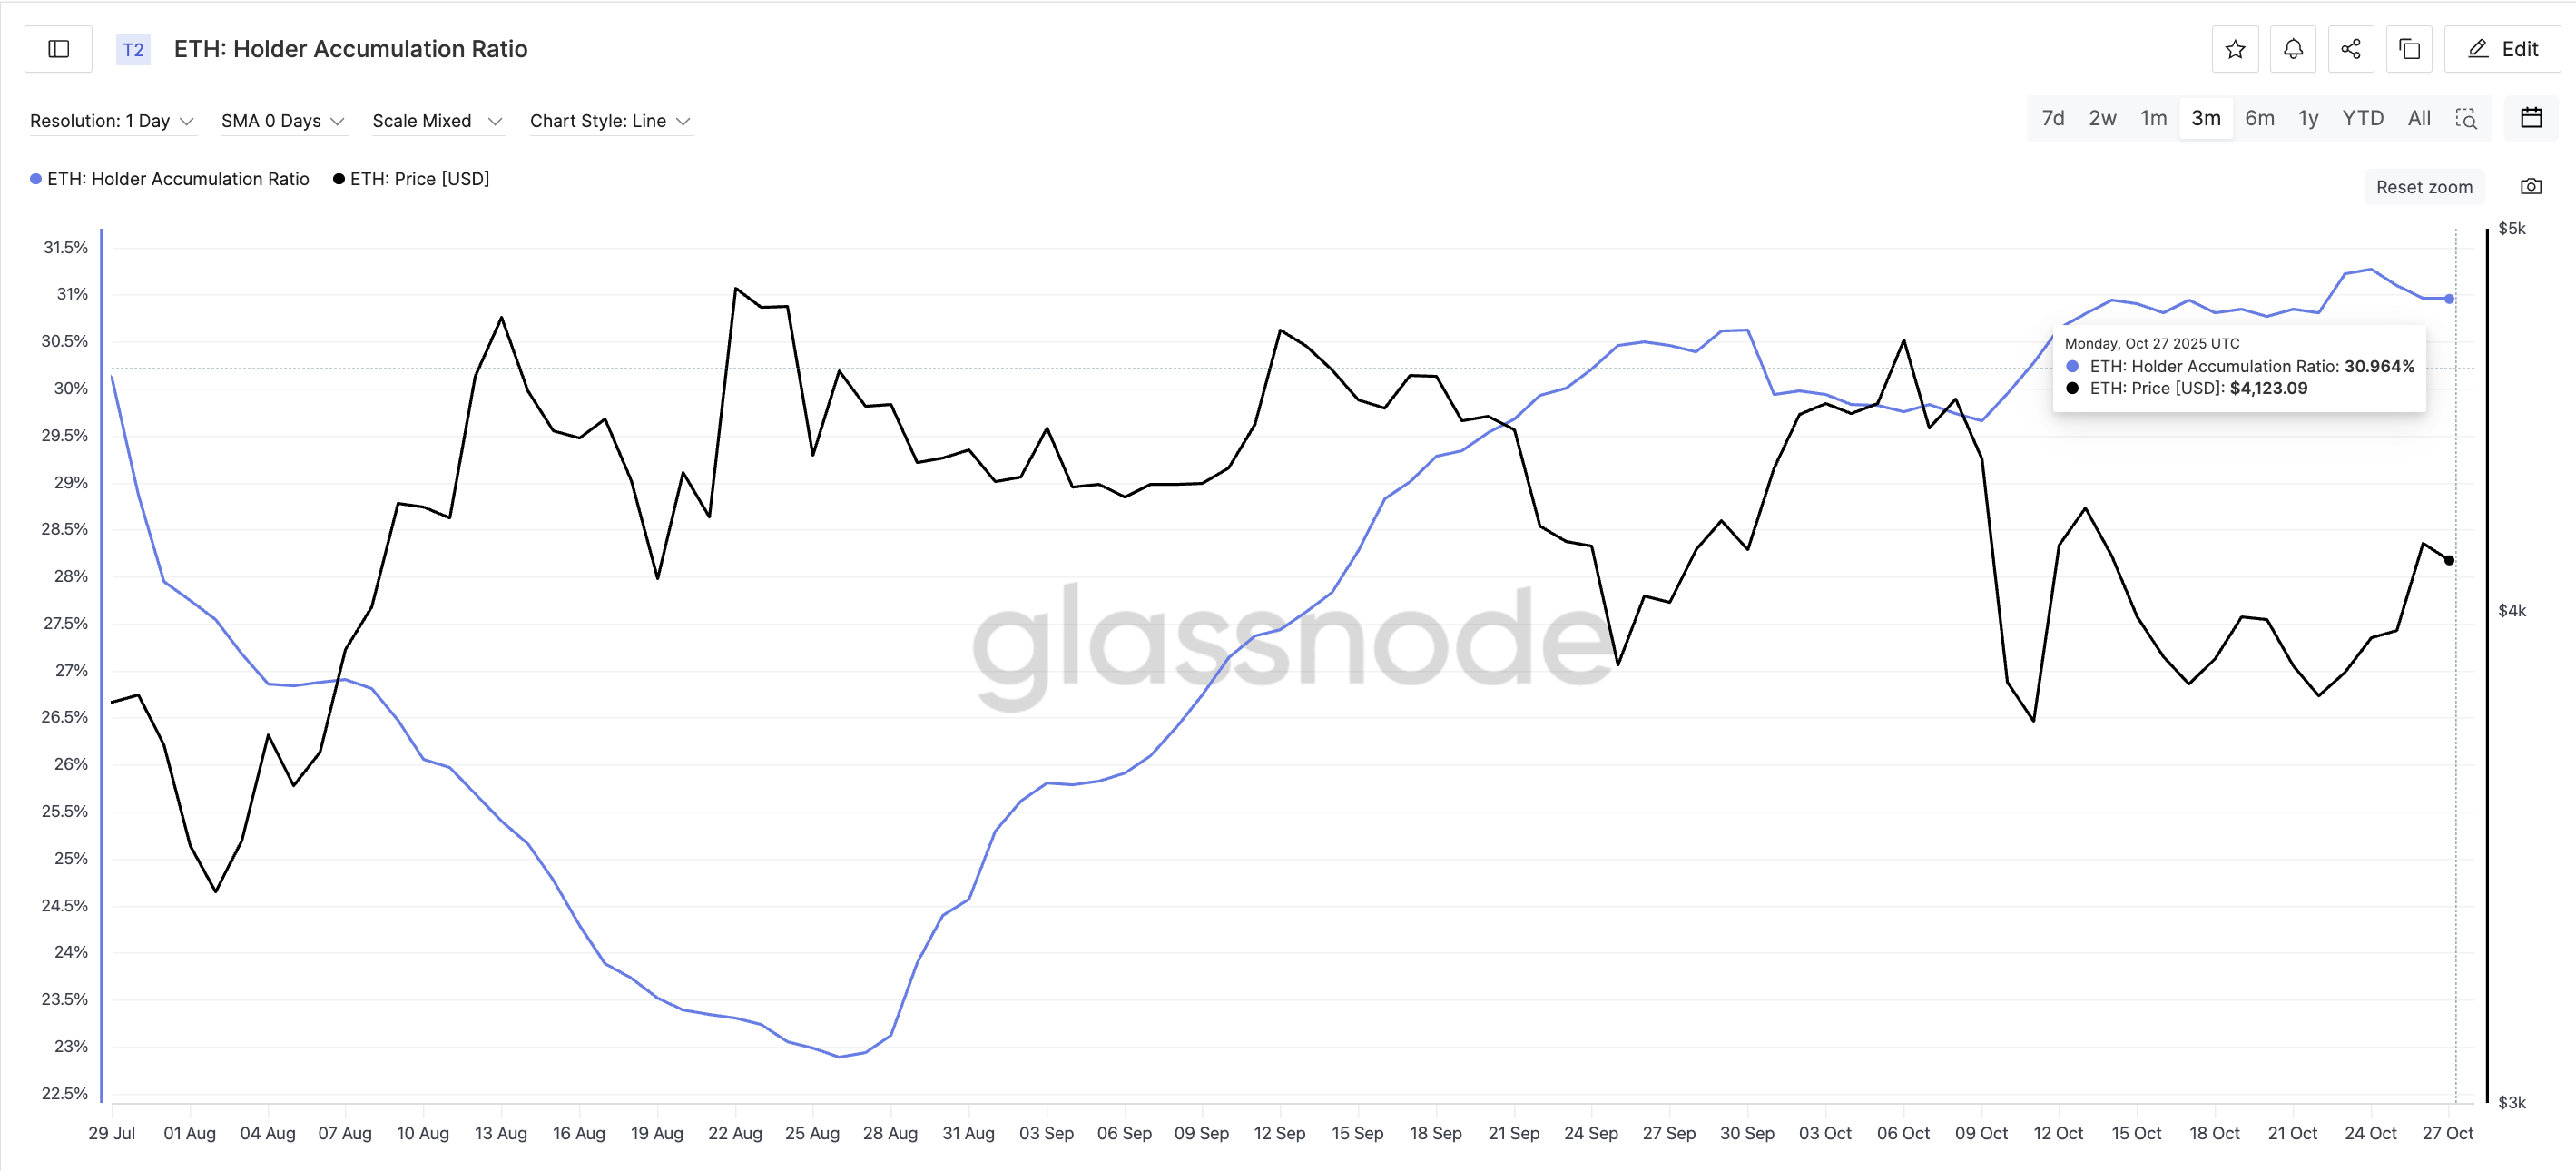 ETH Holders Step Back And Accumulate Fewer Coins:
Glassnode
ETH Holders Step Back And Accumulate Fewer Coins:
Glassnode
Want more token insights like this? Sign up for Editor Harsh Notariya’s Daily Crypto Newsletter here.
That drop means fewer addresses are adding ETH even as the price rises — suggesting traders are turning cautious or waiting for a better entry.
At the same time, exchange flows confirm that shift in sentiment. The exchange net position change, which shows how much ETH is leaving exchanges, has become less negative. On October 15, outflows stood near 1.94 million ETH, but by October 27, they had narrowed to 1.10 million ETH, marking a 43% reduction.
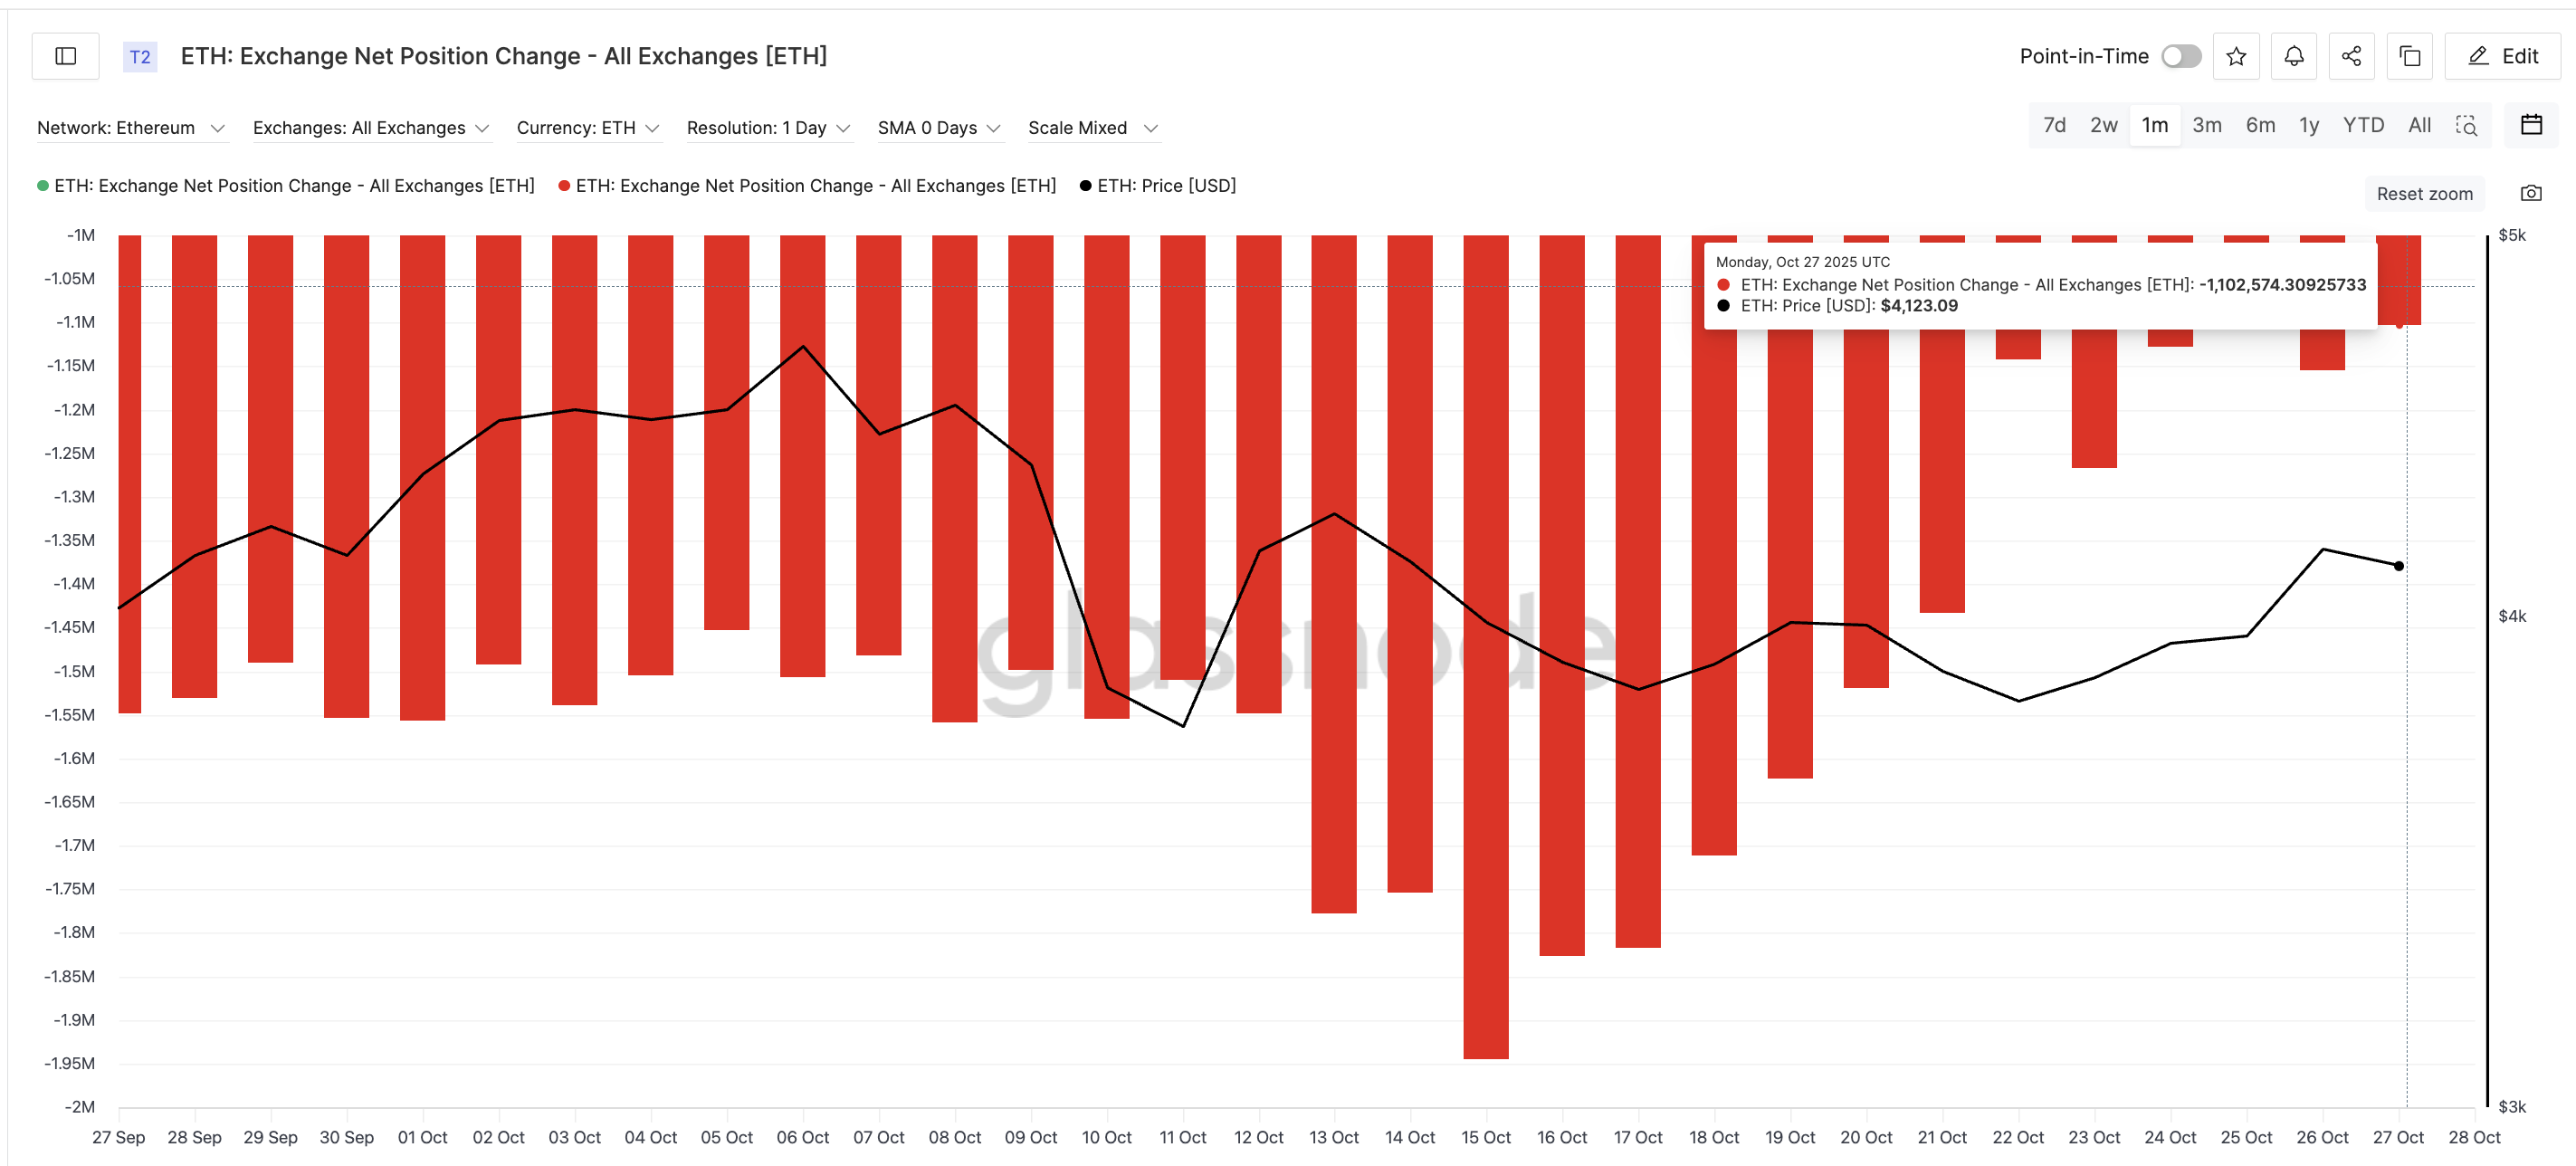 Ethereum Sellers Are Back:
Glassnode
Ethereum Sellers Are Back:
Glassnode
When outflows shrink, it usually means holders are leaving more ETH on exchanges — a sign of rising short-term selling interest. These two factors together show why Ethereum’s breakout attempt couldn’t sustain momentum.
Supply Cluster Keeps The Rally Contained
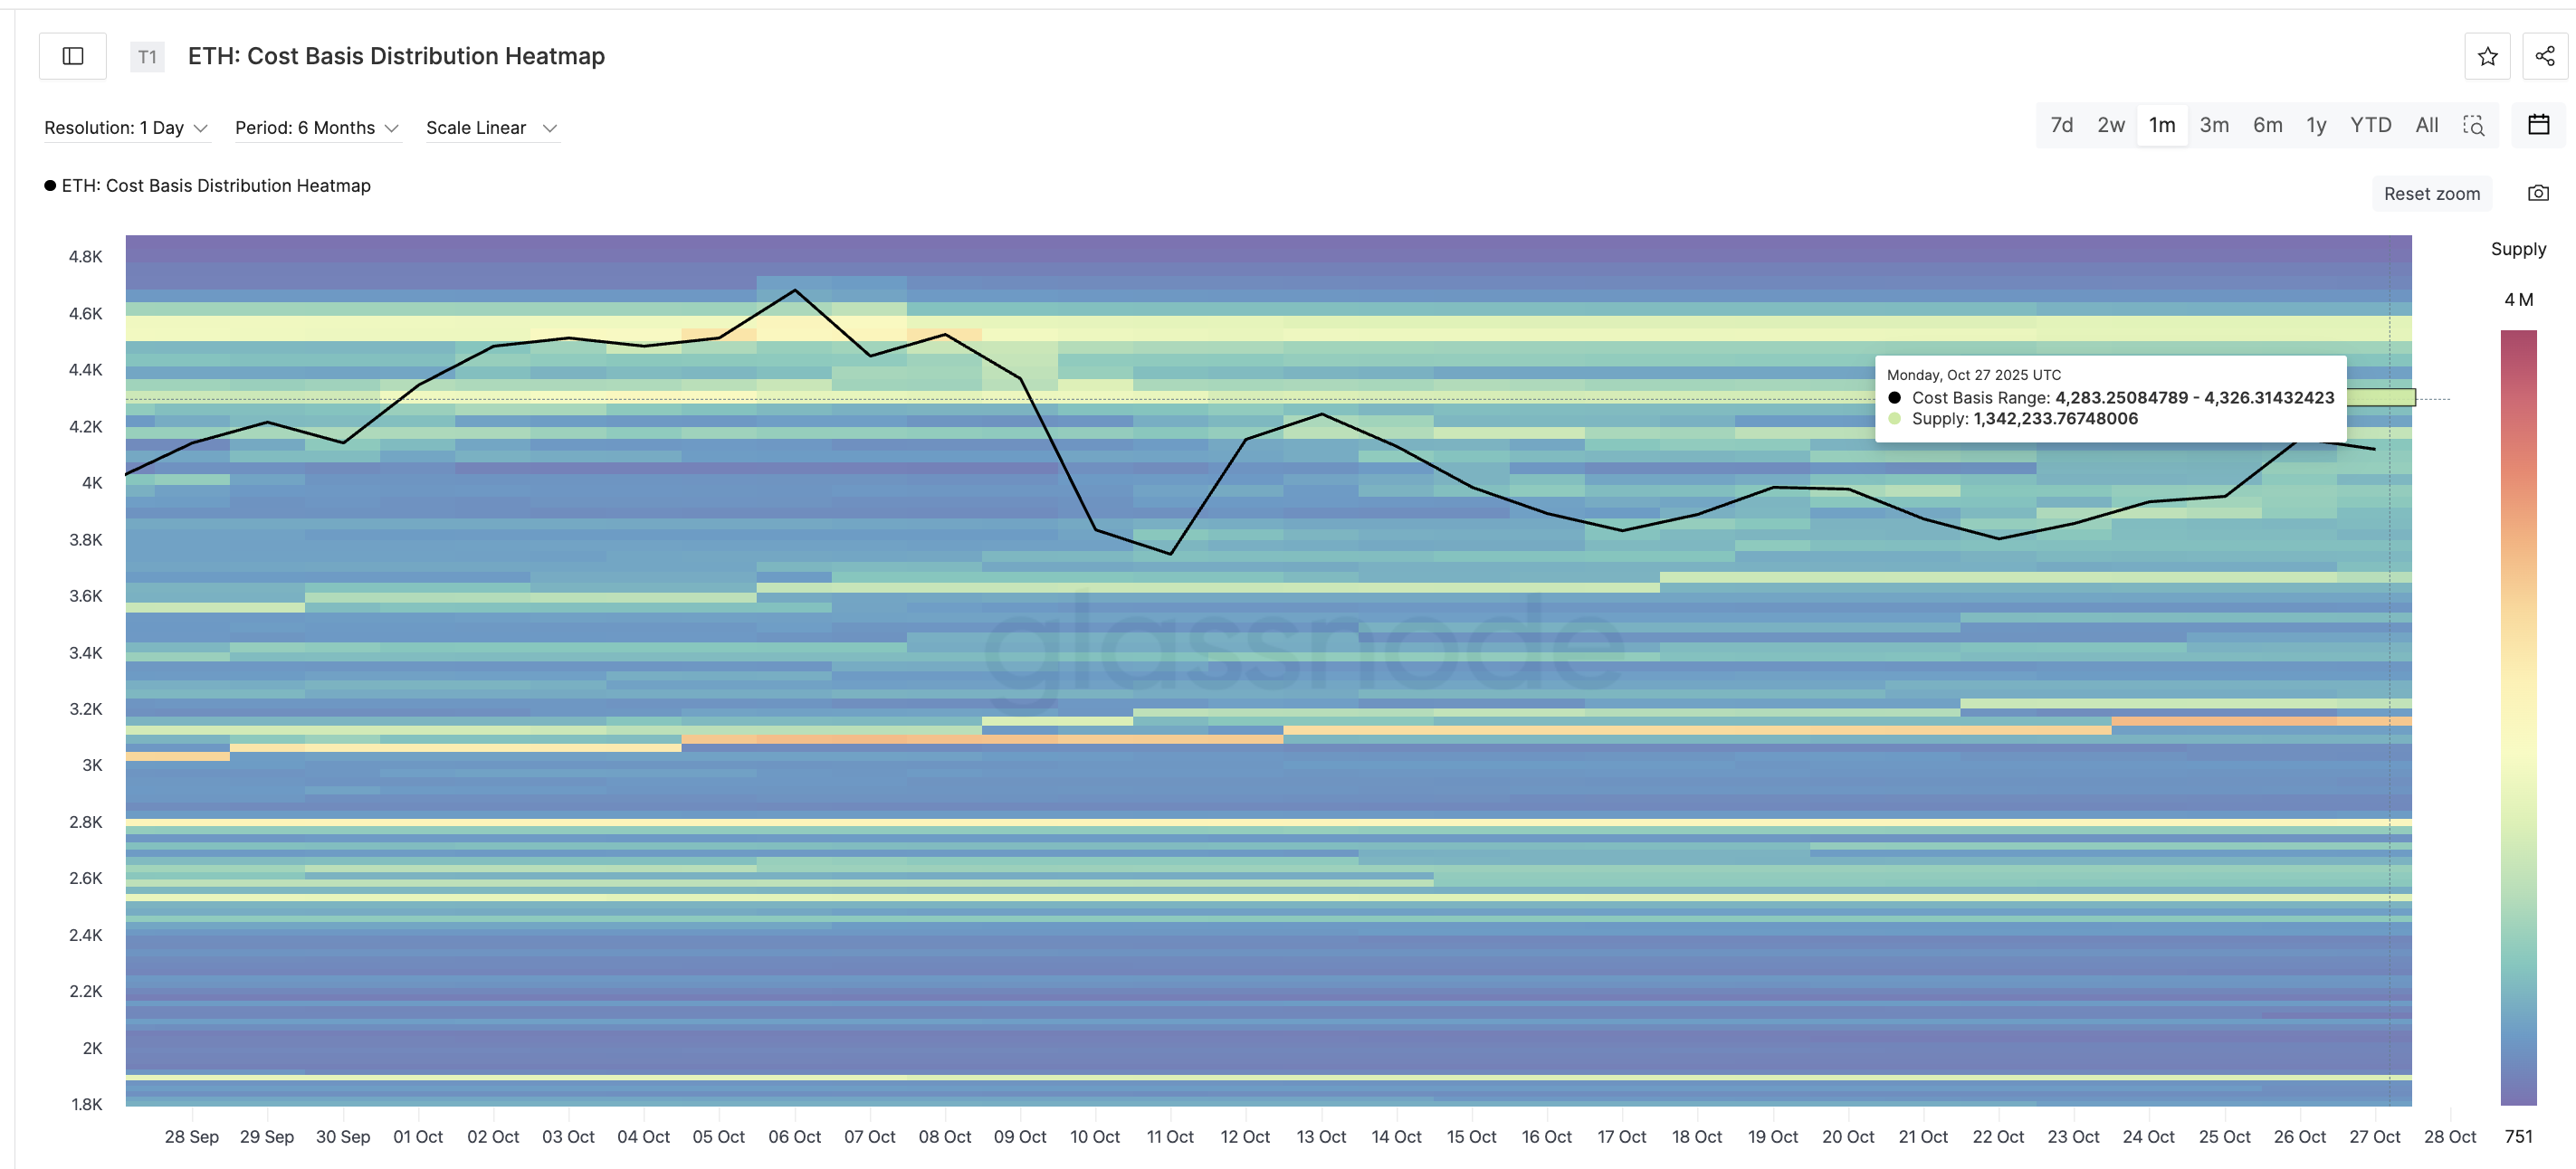
The cost-basis heatmap, which highlights where large batches of ETH were last bought, shows the strongest supply cluster between $4,283 and $4,326, totaling around 1.34 million ETH.
That is the same zone where Ethereum’s rally stalled — the $4,254-$4,395 range seen on the chart (highlighted later). So every time ETH nears this area, prior buyers may start selling to lock profits, adding pressure.
 Strongest ETH Clusters:
Glassnode
Strongest ETH Clusters:
Glassnode
Until this wall is cleared, Ethereum’s move higher is likely to keep failing. But not everything looks weak.
The Ethereum Price Setup Remains Balanced
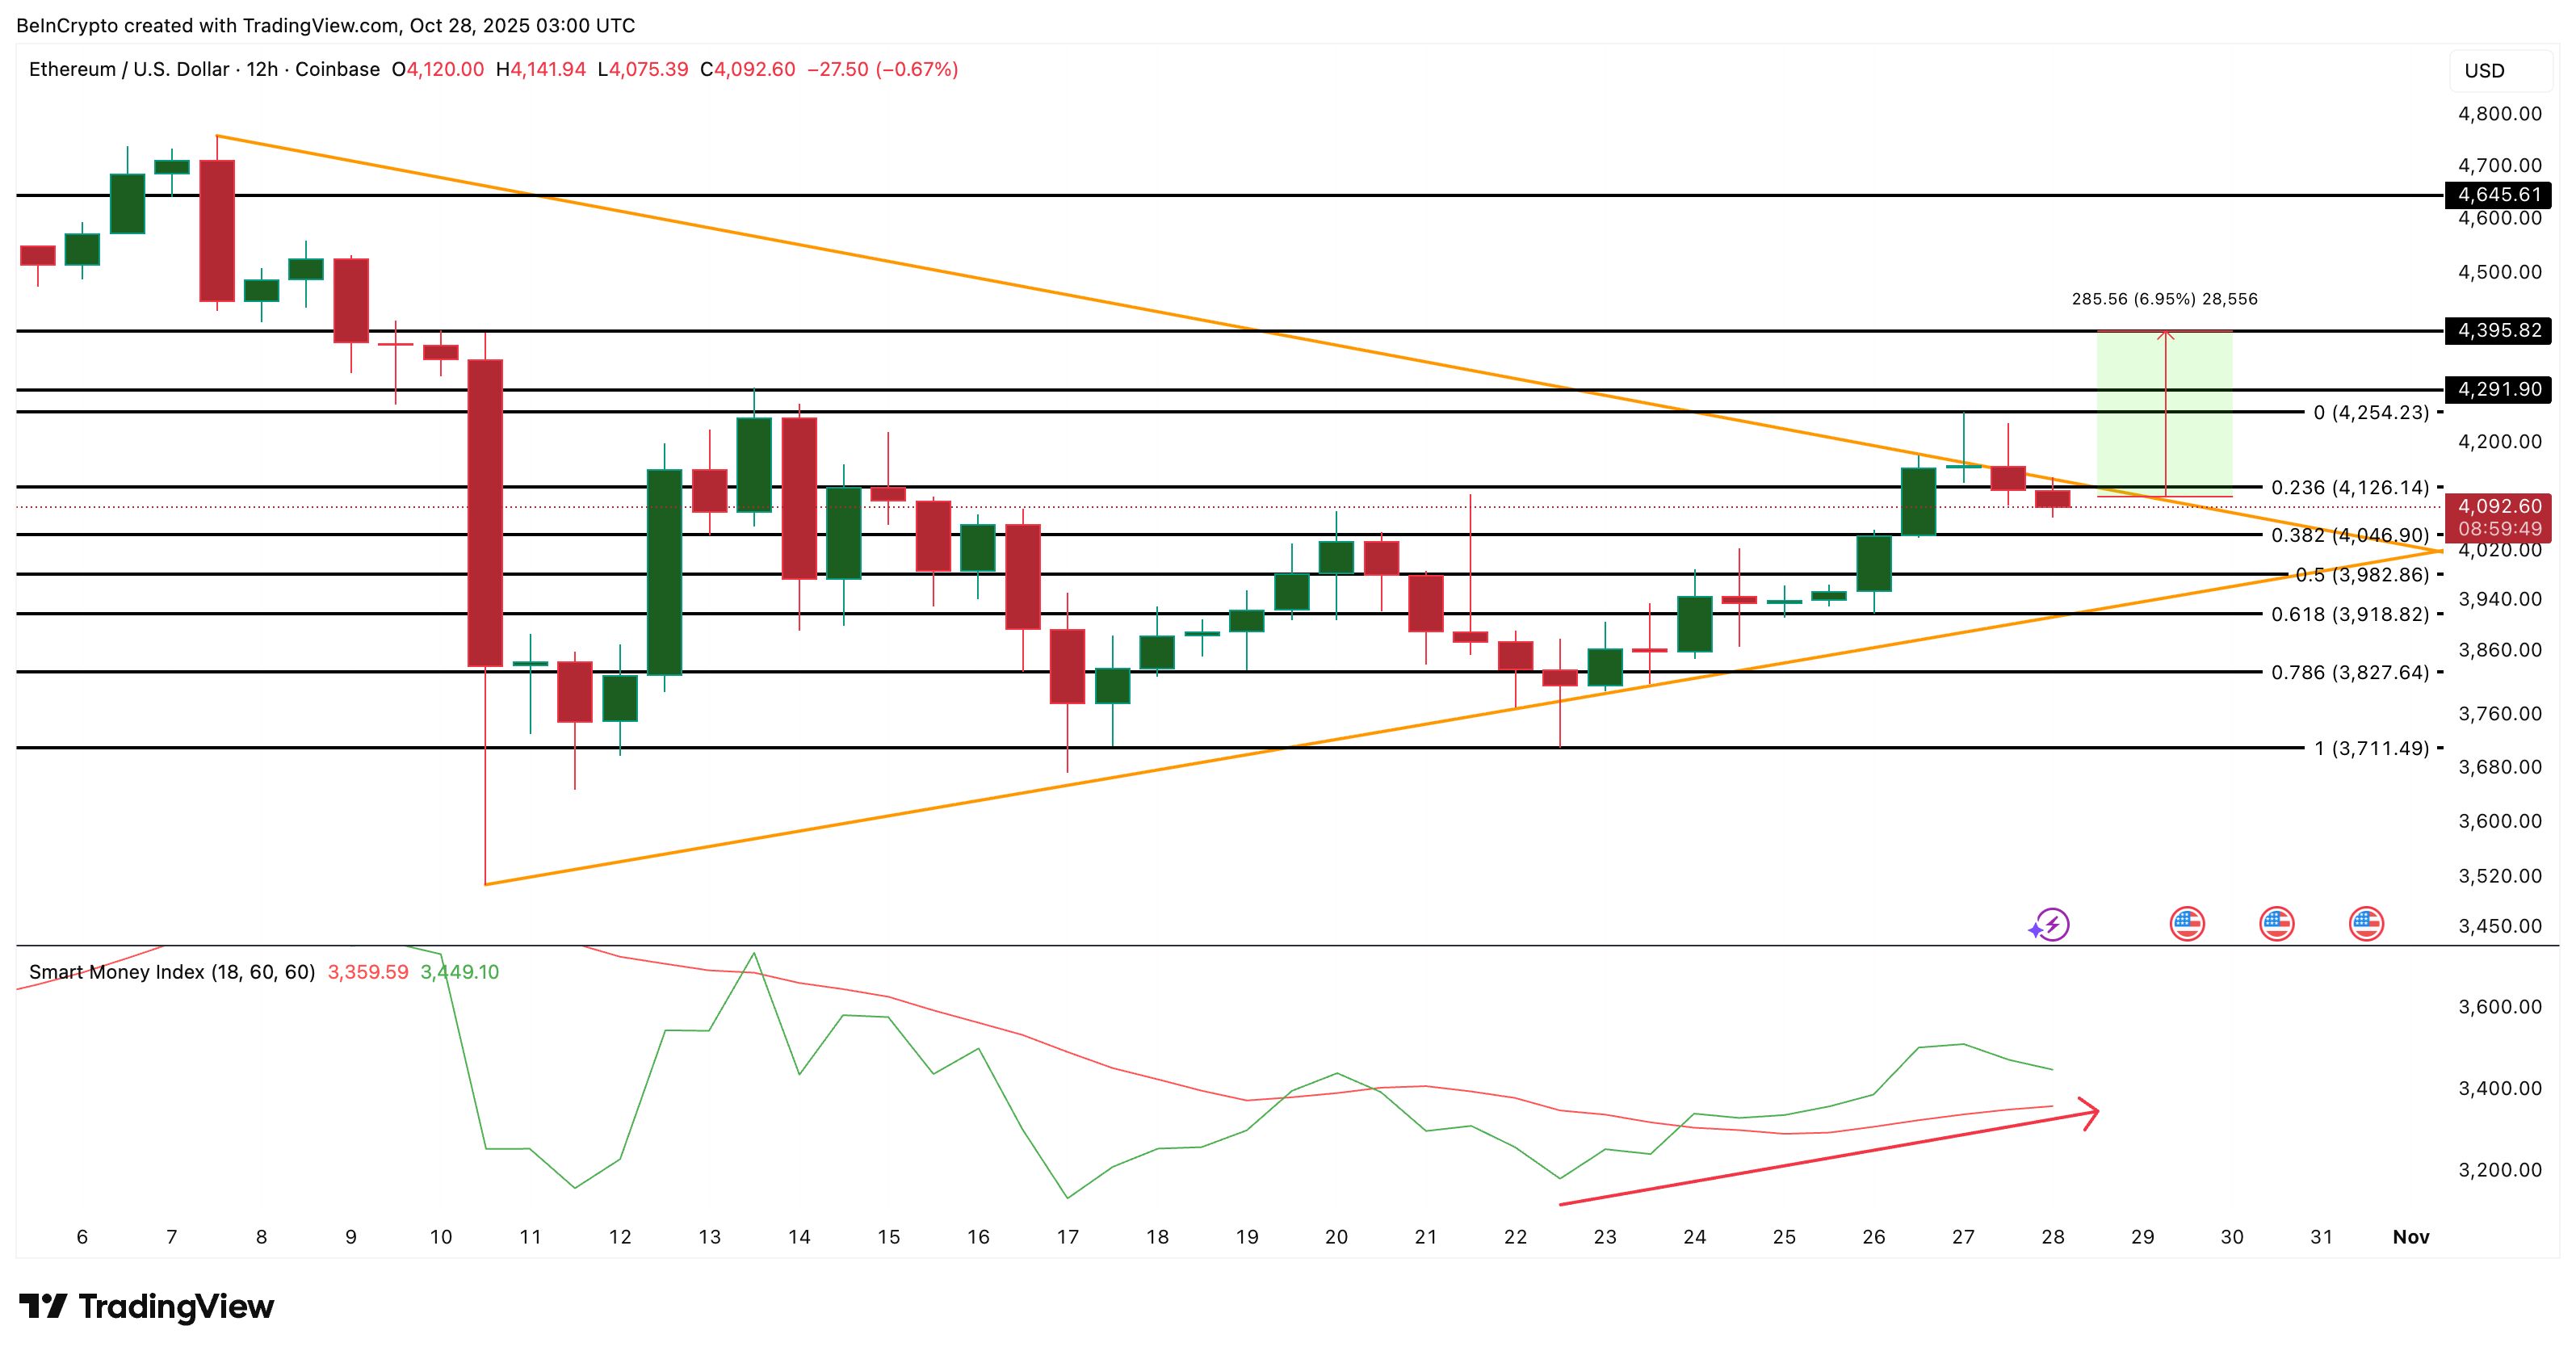
Ethereum continues to move inside a symmetrical triangle that has held since October 7. The latest rejection at the upper trendline on October 27 confirmed strong resistance but didn’t break the broader setup.
For the Ethereum price to regain momentum, it needs to close firmly above the triangle’s upper boundary and hold that move. That would open a path toward the next key resistance band. The first level to cross would be $4,254, followed by $4,395 (a near 7% rise).
Crossing these levels, courtesy of a 12-hour candle close, would also mean breaking through the cost basis cluster mentioned earlier.
 Ethereum Price Analysis:
TradingView
Ethereum Price Analysis:
TradingView
There is enough reason to believe that the cluster (resistance zone) might eventually break. The Smart Money Index — which tracks trading activity from wallets historically known for outperforming the market — has been making higher lows since October 22.
This means that while prices have climbed, these wallets have continued accumulating, signaling confidence in a near-term rebound.
But if the price falls below $3,918, the pattern weakens, exposing $3,711 as the next support. That would defeat the bullish outlook and smart money optimism.
Disclaimer: The content of this article solely reflects the author's opinion and does not represent the platform in any capacity. This article is not intended to serve as a reference for making investment decisions.
You may also like
Mars Morning News | The Federal Reserve is expected to cut interest rates on Wednesday, S&P Global assigns a "B-" credit rating to Strategy
S&P Global has assigned a "B-" credit rating to bitcoin treasury company Strategy, classifying it as junk debt but with a stable outlook. The Federal Reserve is expected to cut interest rates by 25 basis points, with a possible split in the voting. The Hong Kong Securities and Futures Commission has launched a tender for a virtual asset trading monitoring system. Citi is partnering with Coinbase to explore stablecoin payment solutions. ZEC surged significantly due to halving and privacy topics. Summary generated by Mars AI. The accuracy and completeness of this summary are still being refined and updated by the Mars AI model.

BTC Volatility Review (October 6 - October 27)
Key indicators (4:00 PM Hong Kong time on October 6 -> 4:00 PM Hong Kong time on October 27): BTC/USD -6.4...

Cathie Wood warns: As interest rates rise next year, the market will be "chilled to the bone"
AI faces adjustment risks!
2025 Trading Guide: Three Essential Trading Categories and Strategies Every Trader Must Know
Clearly identify the type of transaction you are participating in and make corresponding adjustments.