

Date: Tue, Oct 28, 2025 | 07:08 AM GMT
The broader cryptocurrency market is witnessing a mild pullback today as Bitcoin (BTC) and Ethereum (ETH) slipped into the red, with ETH dropping by over 3%. This short-term correction is slightly pressuring several altcoins — including Aster (ASTER), a leading DEX-focused token.
While ASTER has dipped by over 5%, the chart reveals something far more interesting than just a red candle. A classic bullish pattern appears to be taking shape, one that could set the stage for a potential rebound in the coming sessions.
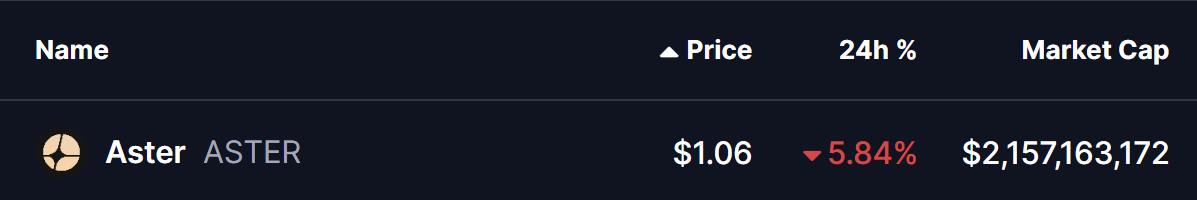 Source: Coinmarketcap
Rounding Bottom in Play?
On the 4-hour chart, ASTER seems to be carving out a rounding bottom formation — a well-known bullish reversal pattern that often signals the transition from a downtrend into a new uptrend.
As seen on the chart, ASTER’s price dropped from its recent local high of $1.22 and declined to test the bottom support zone near $1.0381. This level acted as a crucial demand area where buyers have started to step back in.
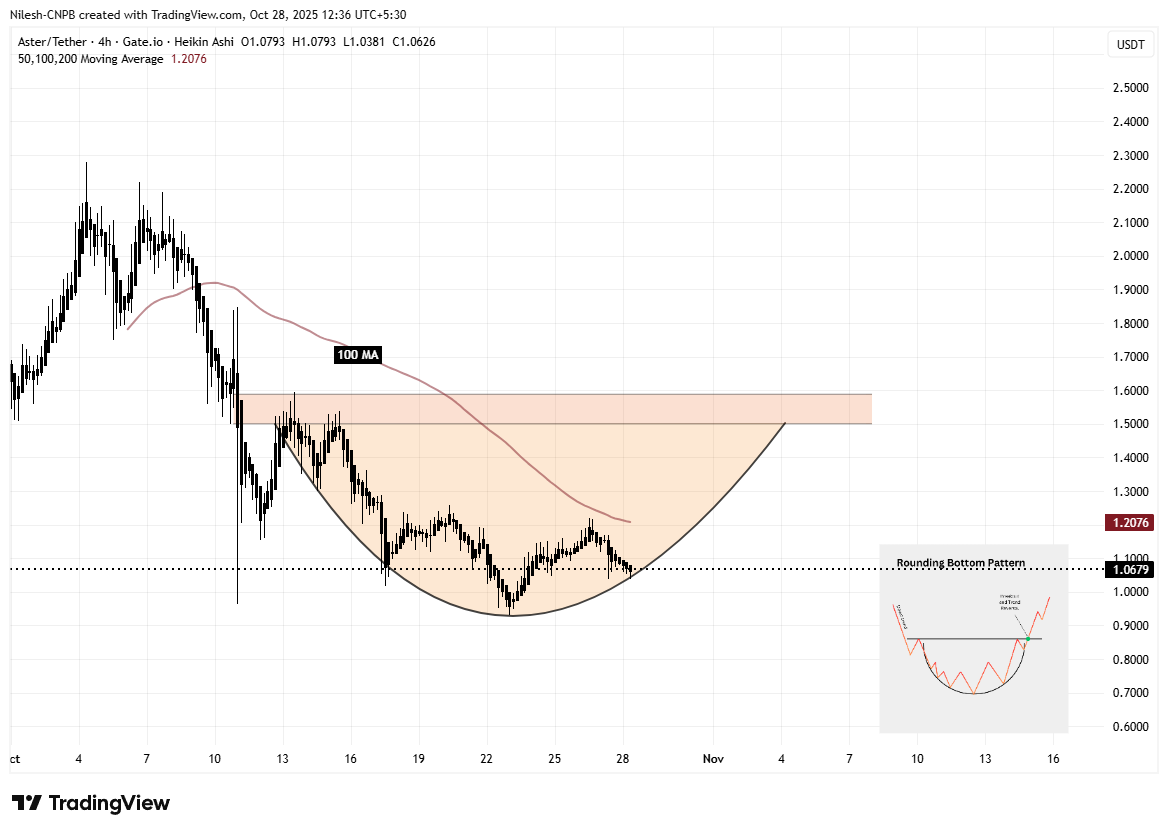 Aster (ASTER) 4H Chart/Coinsprobe (Source: Tradingview)
Currently, the token is trading just above that support at $1.0679, showing early signs of resilience and potential stabilization.
What’s Next for ASTER?
For the rounding bottom pattern to fully confirm, ASTER needs to rebound from its current support and reclaim the 100-hour MA at $1.2076. A clean breakout and close above this level would likely act as a trend confirmation signal, paving the way for a retest of the neckline resistance zone between $1.50 and $1.60.
If bulls manage to break through that zone, the move could trigger a strong bullish rally, potentially marking the start of a sustained uptrend.
However, it’s worth noting that as long as ASTER remains below its 100-hour MA, the setup still carries downside risk. A failure to hold the $1.0 support could delay the bullish reversal and lead to short-term consolidation.